Figure 1.
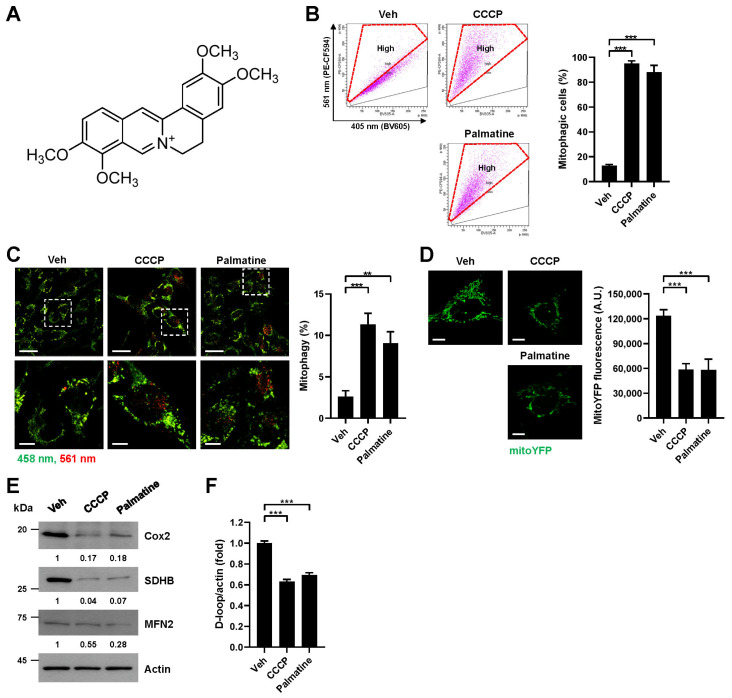
Verification of mitophagy induction by palmatine. (A) Chemical structure of palmatine. (B–F) BEAS-2B cells expressing mt-Keima (B,C), BEAS-2B cells expressing mitoYFP (D) or BEAS-2B cells (E,F) were treated with carbonyl cyanide m-chlorophenyl hydrazone (CCCP) (10 μM) or palmatine (400 μM) for 24 h. Mitophagy levels were analyzed by flow cytometry (B). The results from repeated experiments are shown as the mean ± SD. Mitophagy levels were analyzed by confocal microscopy (C). The results from three biological replicates are shown as the mean ± SD. Scale bar: 20 μm (upper). The boxed regions are enlarged in the bottom panel. Scale bar: 10 μm (bottom). The fluorescence intensity of mitoYFP was analyzed by confocal microscopy (D). Quantified fluorescent intensities from three biological replicates with several images per biological repeat are shown on the right as the mean ± SD. Scale bar: 10 μm. Cell lysates were subjected to western blot analysis using the indicated antibodies (E). Numbers below the corresponding blot represent densitometry values normalized to actin. The intracellular mitochondrial DNA (mtDNA) content was analyzed by real-time PCR with primer sets targeting the mitochondrial DNA D-loop and actin as a control for nuclear DNA (F). The results from three biological replicates are shown as the mean ± SD. Significance was determined by one-way ANOVA with Šidák’s multiple-comparison test. ** p < 0.01; *** p < 0.001.

