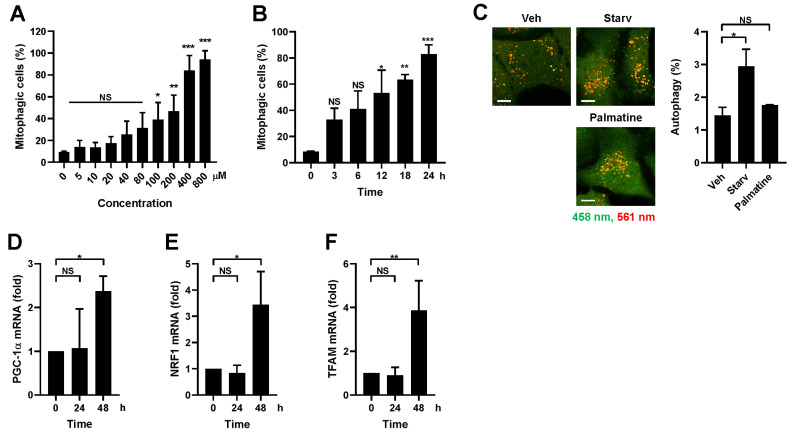
Figure 2.
Analysis of mitophagy-specific induction and mitochondrial biogenesis upon palmatine treatment. (A) BEAS-2B cells expressing mt-Keima were treated with palmatine at the indicated concentration for 24 h and mitophagy levels were analyzed via flow cytometry. (B) BEAS-2B cells expressing mt-Keima were treated with palmatine (400 μM) for the indicated periods and mitophagy levels were analyzed via flow cytometry. The results from three biological replicates are shown as the mean ± SD. (C) BEAS-2B cells expressing Keima were starved for 3 h or treated with palmatine (400 μM) for 24 h and autophagy levels were analyzed using confocal microscopy. Scale bar: 10 μm. (D–F) BEAS-2B cells were treated with palmatine (400 μM) for 24 h. Cells were harvested at the indicated time points and the mRNA levels of PGC-1α (D), NRF1 (E), and TFAM (F) were measured via quantitative real-time PCR. The results from three biological replicates are shown as the mean ± SD. Significance was determined by one-way ANOVA with Šidák’s multiple-comparison test. * p < 0.05; ** p < 0.01; *** p < 0.001. NS, not significant.

