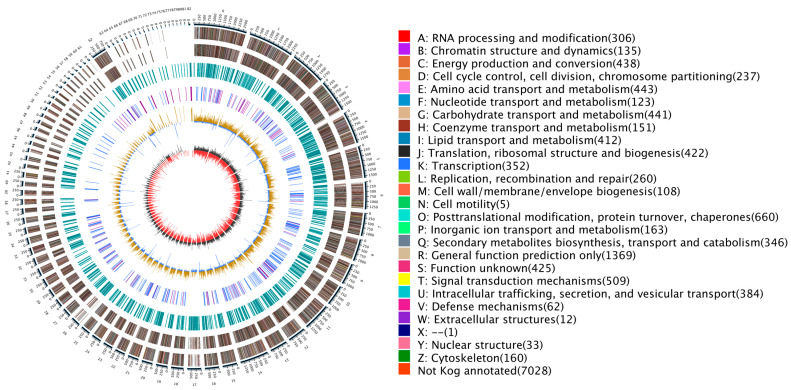
Figure 1.
Represents a genome circular map of A. pullulans. The outermost circle indicates the genome’s size. The second and third circles represent genes on the positive and negative strands of the genome, respectively, with different colors denoting various functional classifications of KOG. The fourth circle illustrates repetitive sequences. The fifth circle displays tRNA and rRNA, with tRNA in blue and rRNA in purple. The sixth circle denotes the GC content, with light yellow indicating regions with GC content higher than the genome’s average GC content. Higher peaks represent greater differences from the average GC content, while blue areas represent regions with GC content lower than the genome’s average. The innermost circle displays GC-skew, where dark gray represents regions with a higher G content than C, and red represents regions with a higher C content than G.

