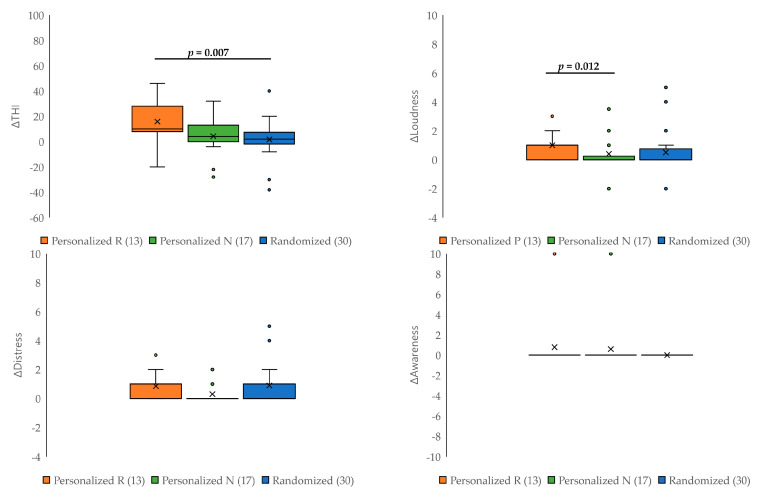
Figure 4.
Comparison of changes in questionnaire scores between the personalized responder subgroup (Personalized R), the personalized non-responder subgroup (Personalized N), and the randomized group. The improvement in THI score was greatest in the responder subgroup and was significantly greater than that in the randomized group (p = 0.007). A significant improvement in the tinnitus loudness score was observed in the responder subgroup compared with the non-responder subgroup (pBonf = 0.012).

