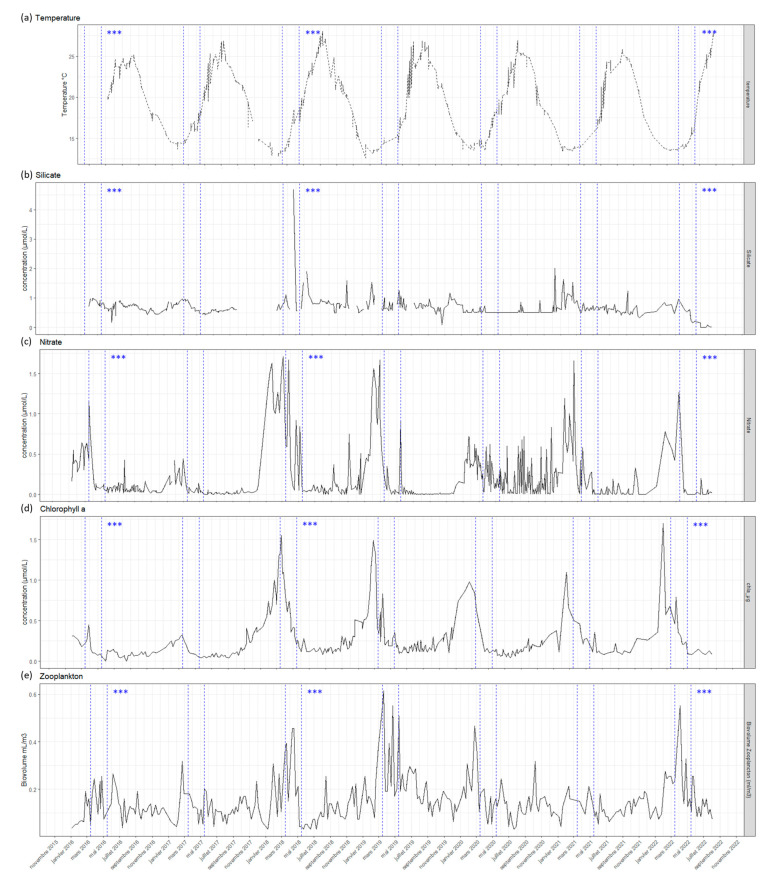
Figure 8.
Evolution of abiotic and biotic factors over the last seven years in Calvi Bay: dashed lines represent the period of maximum blooms when the observations and sampling were made; the asterisks refer to years with intense blooms. (a) Temperature in °C; (b) silicate in µmol/L; (c) nitrate in µmol/L; (d) chlorophyll a in µg/L and (e) zooplankton biovolumes in mL/m3; dashed lines represent the maximum bloom periods; the asterisks refer to years with intense Haslea spp. blooms.

