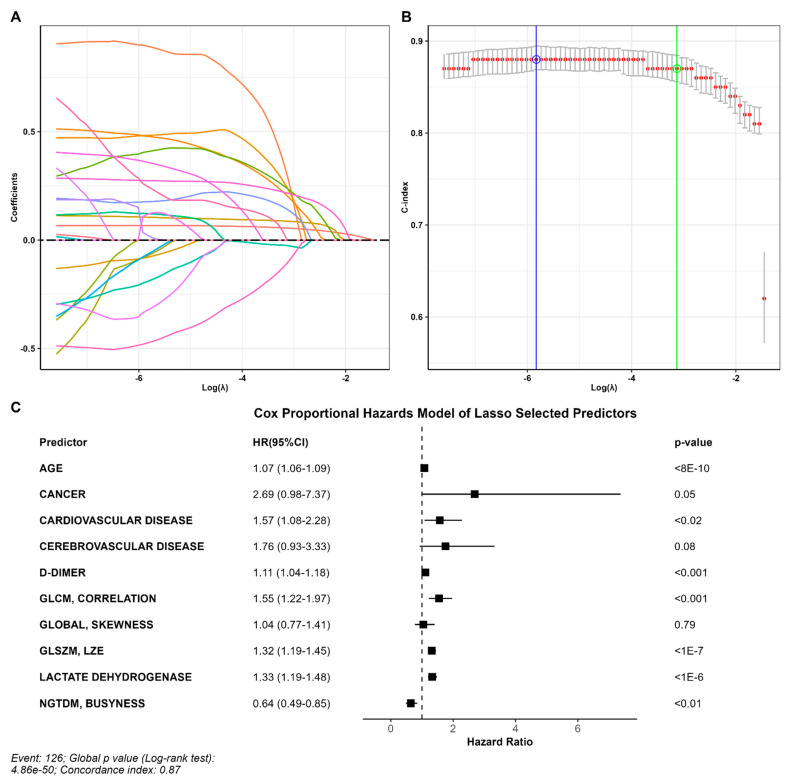
Figure 2.
Predictors of outcome. (A) Coefficient profile plotted versus the log (λ). Each colored line represents the coefficient of each feature. (B) The C-index was plotted versus log (λ). The green circle and line locate the Lambda with minimum cross-validation error. The blue circle and line locate the point with minimum cross-validation error plus one standard deviation. (C) Variables that survived the LASSO regression, including age, D-dimer, LDH, three comorbidities, and four radiomic variables.

