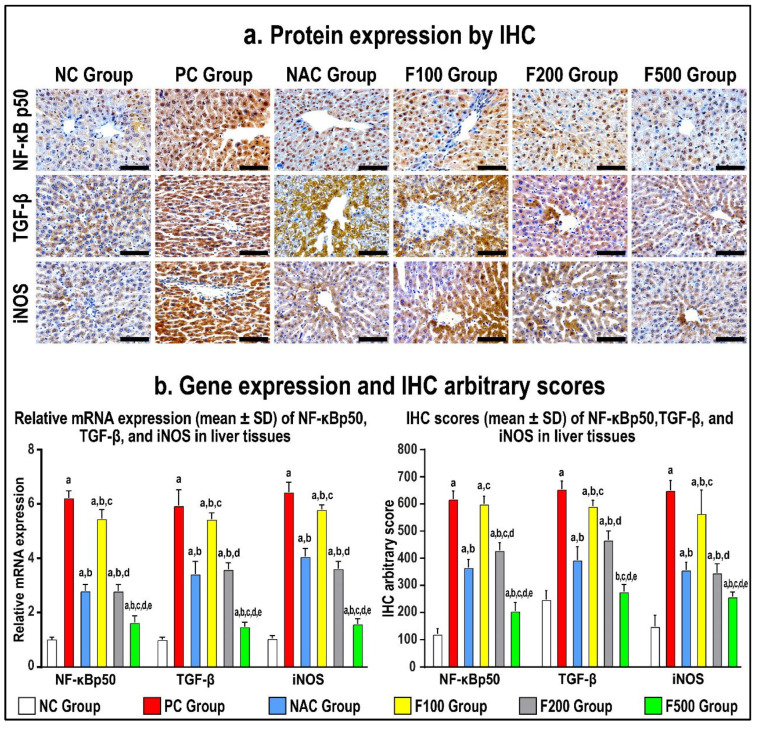
Figure 6.
Immunohistochemistry (IHC) localization of NF-кB p50, TGF-β, and iNOS (40× objective; scale bar = 10 mm) alongside liver tissues in untreated acute liver toxicity with paracetamol (PC) and rats treated with different doses of FUC (100 mg/kg, 200 mg/kg, and 500 mg/kg) and NAC in comparison to normal control (NC) rats (a). (b) The relative mRNA expression and IHC scores in the different study groups are displayed as graph bars (data are shown as mean ± SD; a: p < 0.05 compared with the PC group; b: p < 0.05 compared with the NAC group; c: p < 0.05 compared with the F100 group; d: p < 0.05 compared with the F200 group; and e: p < 0.05 compared with the F500 group).

