Figure 2.
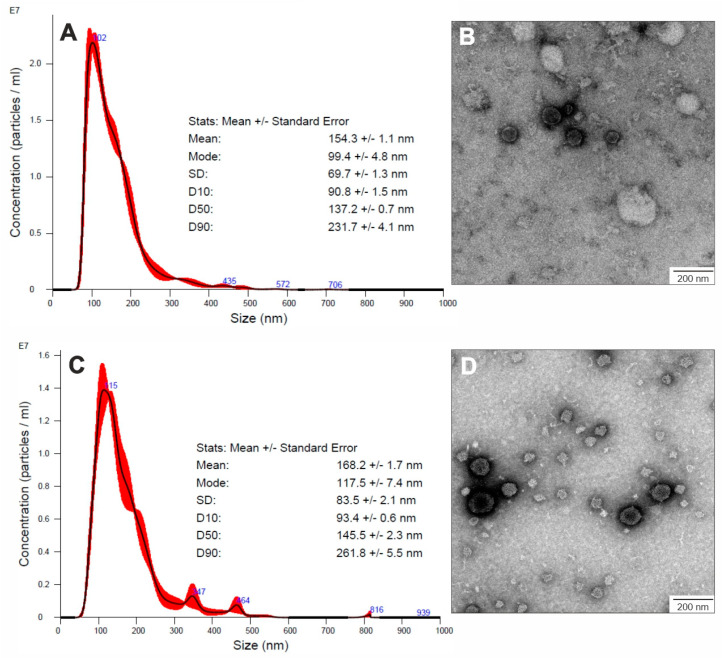
Characteristics of EVs produced by C. albicans biofilms. NTA particle size distribution analysis of C. albicans strain SC5314 (A) and strain 3147 (C); representative histograms of the average size distribution from three measurements of a single sample (black line) are presented. The presented numbers indicate the maxima of peaks, and the red areas indicate the standard deviation (SD) between measurements. The size parameters of the EVs are included. TEM images of EVs produced by C. albicans strain SC5314 (B) and strain 3147 (D). Scale bar: 200 nm.

