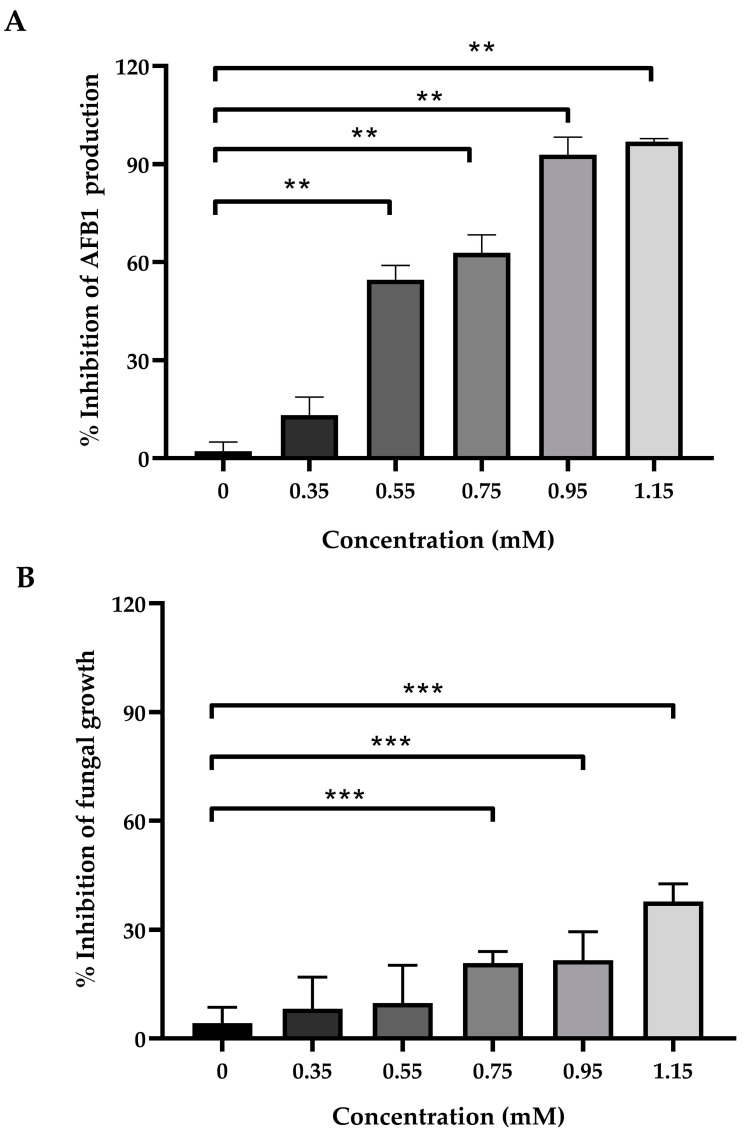
Figure 1.
Effects of MPOBA on the production of AFB1 (A) and the fungal growth (B) of A. flavus 3041. Each bar shows the percentage of inhibition compared with the control. Each data point indicates the mean of six separate experiments ± SD. Statistical differences between the two groups were analyzed using the Mann–Whitney nonparametric test. Significant differences from the control are indicated as follows: ** p < 0.01 and *** p < 0.001.

