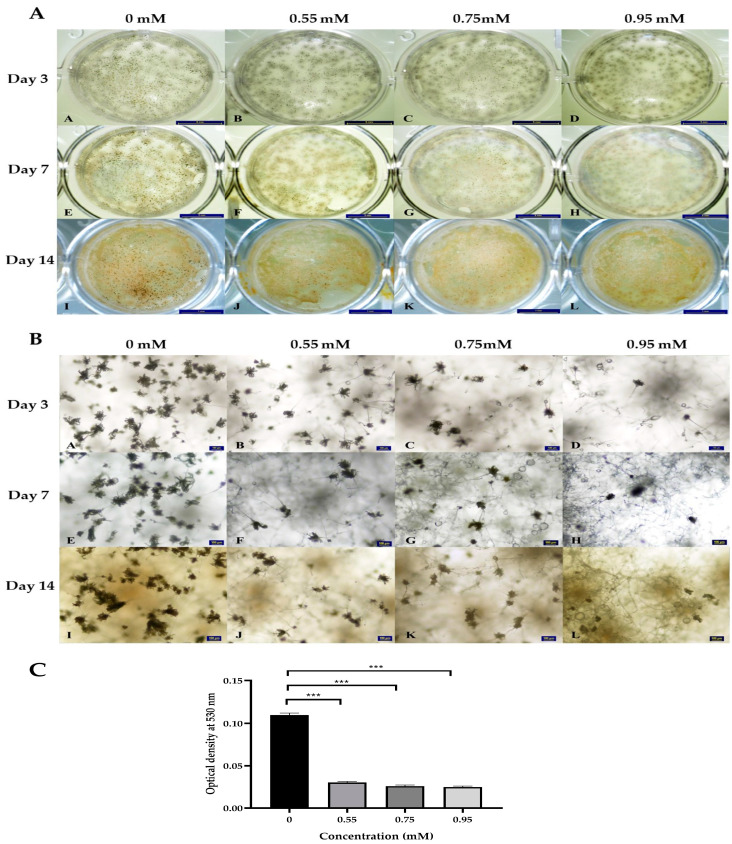
Figure 3.
Effects of MPOBA on sporulation in A. flavus. Growth and sporulation were qualitatively examined by the appearance of the colony under a stereomicroscope (A) and the microscopic morphology under a light microscope (B) on Day 3, Day 7, and Day 14 of incubation. Semi-quantification of sporulation in A. flavus was determined using a spectrophotometer at an optical density of 530 nm on Day 14 of incubation (C). Each data point indicates the mean of five separate experiments ± SD. Statistical differences between the two groups were analyzed using the Mann–Whitney nonparametric test. Significant differences from the control are indicated as follows: *** p < 0.001.

