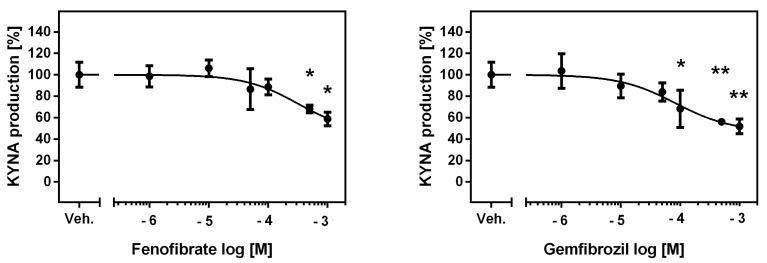
Figure 2.
Effect of fibrates on KAT I activity in rat kidneys in vitro. Data presenting the enzymatic activity as percentage of KYNA synthesis, mean ± SD, n = 3, are plotted against drug concentration on a logarithmic scale. ANOVA followed by Tukey’s multiple comparison test. The figure was prepared in GraphPad Prism 6. * p < 0.05, ** p < 0.01.

