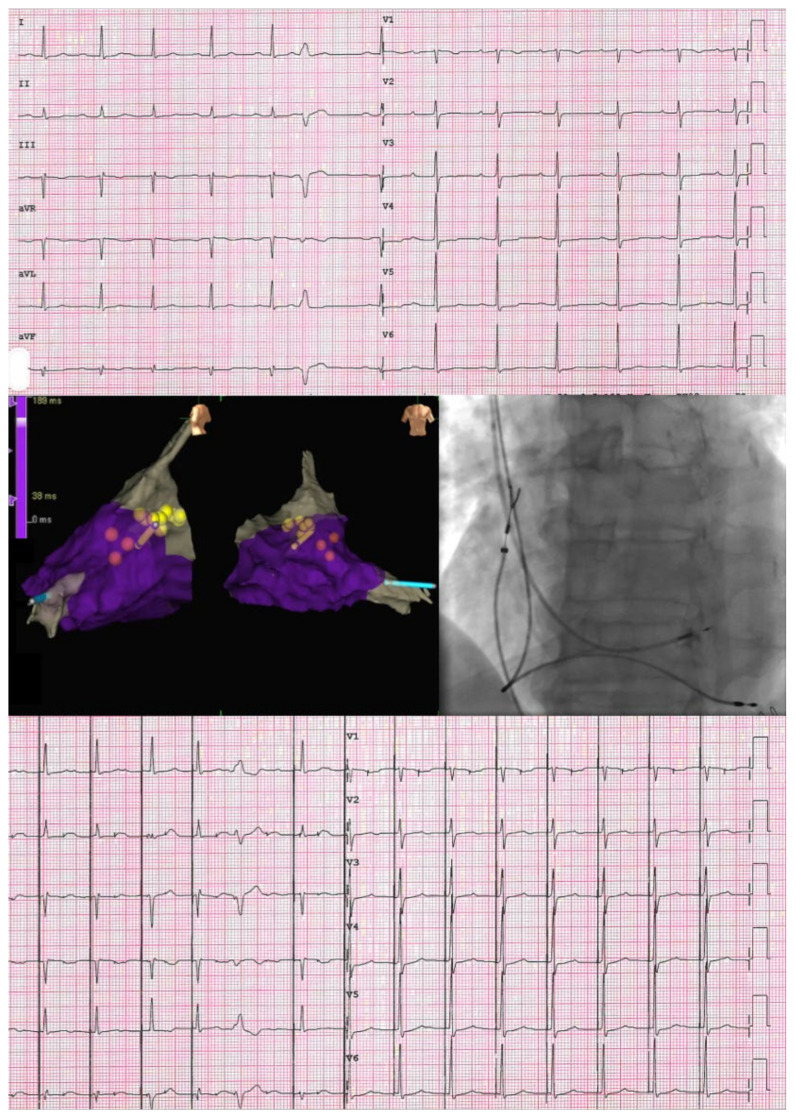
Figure 1.
The upper part of the image shows the spontaneous ventricular activation as a twelve-lead ECG. On the left, a 3DEAM of the RV is displayed in the central part, with highlighted yellow dots representing the His bundle. The yellow catheter corresponds to the His bundle lead, while the light blue catheter represents the RV backup lead. On the right, a fluoroscopic anterior-posterior view of the His lead and the RV backup lead is shown in the central part. An ECG with selective HBP is shown in the inferior part of the image.

