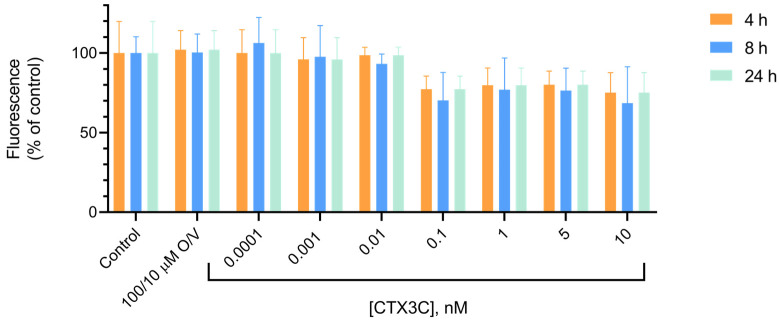
Figure 5.
Alamar blue fluorescence at different times expressed as percentage of the control value, illustrating no significant decrease in fluorescence emitted by treated cells compared to control conditions. Statistical differences were determined by one-way ANOVA and with Dunnett’s multiple comparison test. All the determinations are the mean ± SEM of 3 independent culture plates in triplicate wells.

