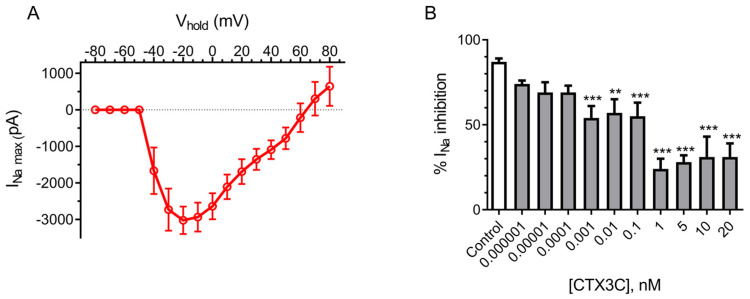
Figure 10.
(A) Current–voltage relationship of sodium current amplitude in the HEK293 Nav1.6 cell line. (B) Inhibition of the maximum peak inward sodium currents by bath application of different CTX3C concentrations. Data are expressed as mean ± SEM and as percentage of inhibition of the sodium current (** p ≤ 0.01, *** p ≤ 0.001).

