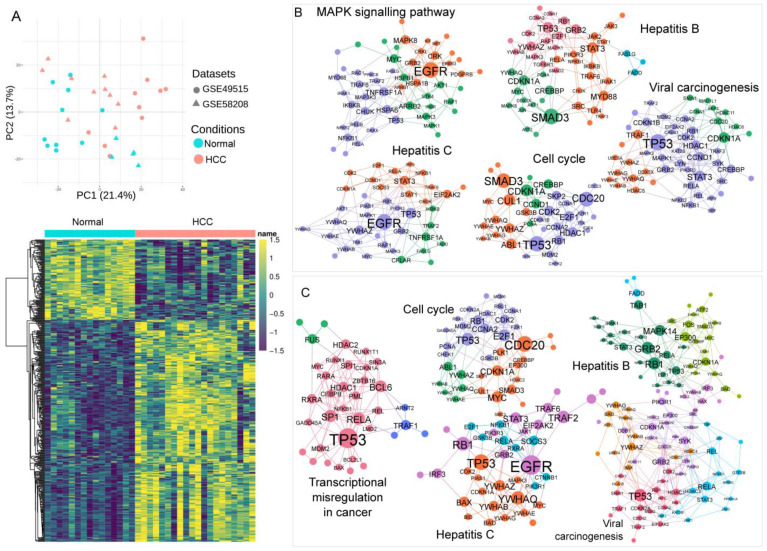
Figure 3.
Results of blood transcriptomics analysis. (A) Principal component analysis and heatmap of the transcriptomics meta-analysis from two datasets: GSE49515 and GSE58208. (B) Blood-specific protein–protein interaction (PPI) network of differentially expressed genes (DEGs) from transcriptomics meta-analysis of hepatocellular carcinoma (HCC) vs. Control. Whole-blood PPI network was generated, and five representative PPI networks are presented. (C) Blood-specific PPI network of DEGs from single transcriptomics analysis of HCC vs. liver cirrhosis. Whole-blood PPI network was generated, and five representative PPI networks are presented.

