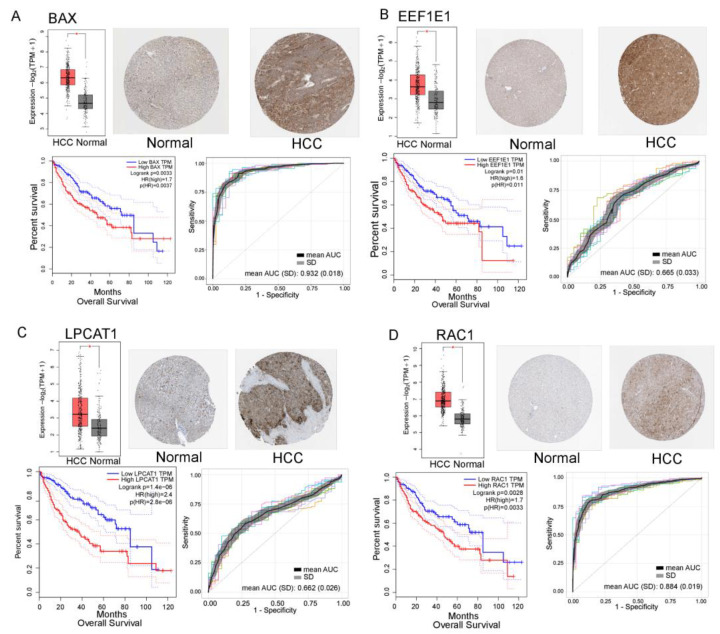
Figure 5.
Bioinformatic analysis of potential protein biomarkers derived from the gene–metabolite interaction network and the lipid-related gene network. (A) BAX. (B) EEF1E1. (C) LPCAT1. (D) RAC1. RNA-seq data from The Cancer Genome Atlas (TCGA) and Genotype-Tissue Expression (GTEx) databases were retrieved to evaluate the expression levels of the candidates. The box plot represents the RNA-seq expression of each candidate in hepatocellular carcinoma (HCC) compared with matched TCGA normal and GTEx data; immunohistochemistry image for each candidate was retrieved from The Human Proteome Atlas. The overall survival Kaplan–Meier plot of each candidate was examined with a median cutoff. The receiver operating characteristic (ROC) curve of the logistic regression model was built using the TCGA-GTEx combined RNA-seq data with 10 times repeated data splitting (7:3); mean area under the curve (AUC) and SD values across 10 models are presented. However, only the first five ROC curves are presented in the graph, colors indicate logistic regression models * Indicates significance with FDR < 0.05. SD: standard deviation.

