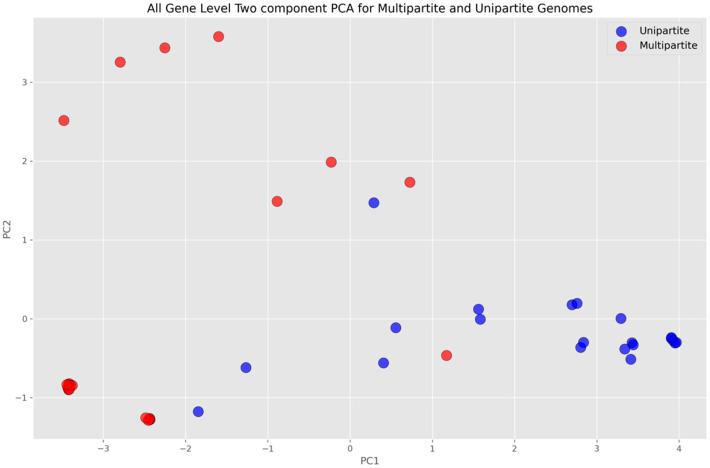
Figure 4.
All-gene-level PCA plot, where blue dots represent unipartite genomes and red dots represent multipartite genomes. The horizontal axis represents the first component and vertical axis represents the orthogonal of first and second components. The genes that appeared consistently in all six rounds of cross-validation were standard-scaled and fit-transformed to perform the analysis.

