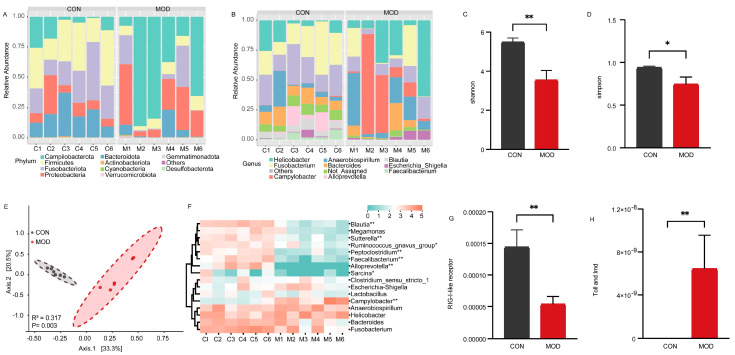
Figure 2.
Bacterial analysis of colonic mucosa in IBD. (A) Bacterial composition in the colonic mucosa at the phylum level. (B) Bacterial composition in the colonic mucosa at the genus level. (C) Comparison of Shannon indices of bacteria in the colonic mucosa. (D) Comparison of Simpson indices of bacteria in the colonic mucosa. (E) Comparison of bacterial communities in the colonic mucosa. (F) Heatmap showing significant differences in the dominant bacterial genera of the colonic mucosa. (G) Comparison of RIG−I−like receptor signaling pathway of bacteria in the colonic mucosa. (H) Comparison of Toll and Imd signaling pathway of bacteria in the colonic mucosa. * and ** indicate p < 0.05 and p < 0.01, respectively.

