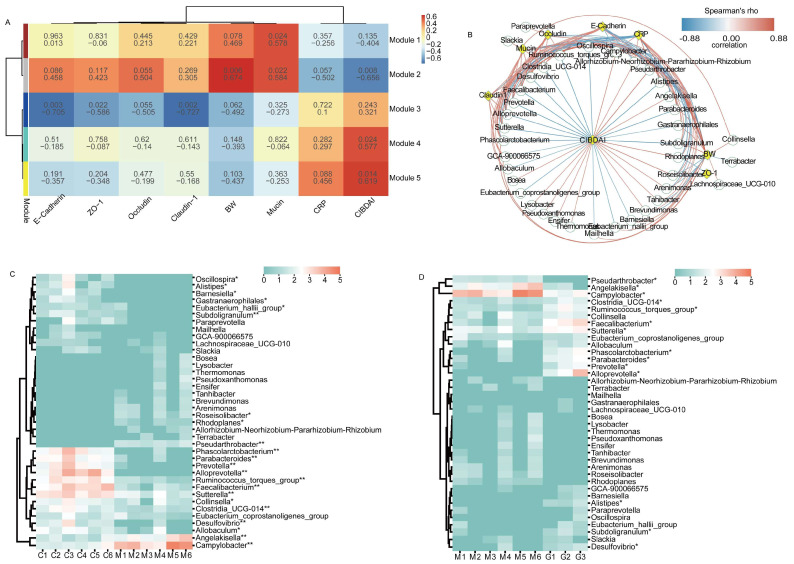
Figure 5.
Correlation analysis between major bacteria and physiological indices. (A) Weighted gene co−expression network analysis. (B) Network plot showing Spearman’s correlation between differentially abundant bacteria and BW, CRP, and mucosal protein levels. (C) Heatmap showing significant differences in the modeling phase. (D) Heatmap showing significant differences in the treatment phase. Note: In Figure (A), the first row in each module represents correlation coefficients, and the second row represents p−values. In Figure (B), green circles and yellow diamonds represent significantly correlated bacteria and physiological indices (BW, CIBDAI, CRP, Mucin, Occludin, Claudin 1, and E−Cadherin), respectively. The significant correlations between bacteria and physiological indices are connected by curves, and the color of the curve lines represents the correlation strength based on the color scheme. The color scheme indicates the Spearman’s rho ranks ranging from −0.88 to 0.88. Positive and negative Spearman’s rho values represent positive and negative correlations, respectively. * and ** indicate p < 0.05 and p < 0.01, respectively.

