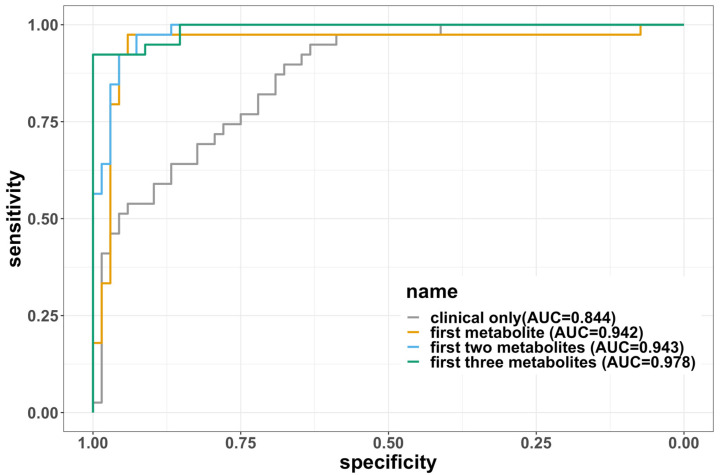
Figure 3.
The ROC curves for each of the four logistic regression models fitted. The curves were created using the full dataset without splitting into training and testing, so the areas under the curves (AUCs) are not the same as the average AUCs in the tables. The AUCs are labeled on the legend. The three metabolites are in the order of (1) lysophosphatidylcholine a C17:0, (2) dihydroceramide (d18:0/24:1), and (3) triacylglyceride (20:4_36:4).

