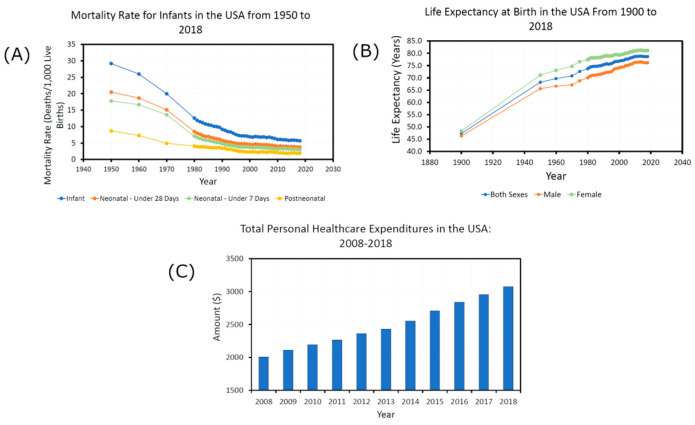
Figure 5.
Health statistics graphs for the USA created from data collated in the report “Health, United States 2019” [140]. Graph (A) shows the infant mortality rate in the USA, measured in deaths per one thousand infants. It decreased from 29.2% in 1950 to 5.7% in 2018. Graph (B) shows the life expectancy at birth for people living in the USA, split into male and female numbers, as well as an overall average. It increased from 47.3% in 1900 to 78.7% in 2018. Graph (C) shows the total healthcare expenditure per person in the USA, which increased from $2009 in 2008 to $3076 in 2018.

