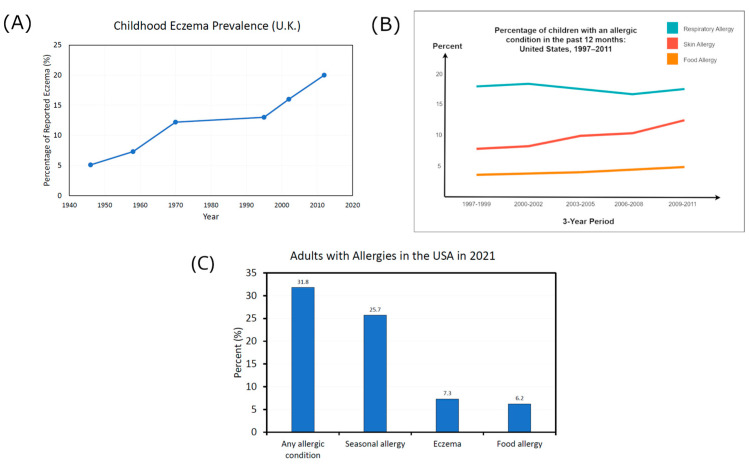
Figure 6.
Graph (A) shows childhood reported eczema prevalence rates in the United Kingdom, which rose from 5.1% in 1946 to 20% in 2012. Data was taken from three sources [141,143,149]. Graph (B) shows the percentage of children aged 0–17 years who reported an allergic condition in the past 12 months from 1997–2011 in the USA. It shows a significant linear increase for food and skin allergies; however, skin allergies seem to be accelerating at a faster rate. Graph (B) was adapted from SOURCE: CDC/NCHS, Health Data Interactive, National Health Interview Survey, https://www.cdc.gov/nchs/data/databriefs/db121.pdf (accessed on 26 June 2023) [150]. Graph (C) shows the percentage of adults with a diagnosed seasonal allergy (25.7%), eczema (7.3%), food allergy (6.2%), or any allergic condition (31.8%) in the United States in 2021 [151]. The criteria for adults counted as having an allergic condition included being diagnosed with one or more of the three conditions shown in the graph. There is some overlap between the three conditions, and the estimated percentages are taken from interviews with a sample of the civilian population in America.

