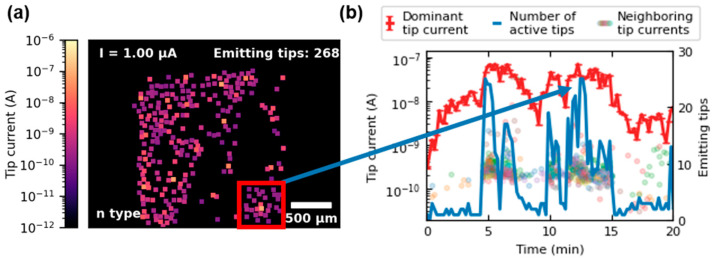
Figure 3.
Clustering phenomenon illustrated for the n-type FEA during the CCM. In (a), the emission heat map of minute 13 of the CCM is shown. The red box marks the area where the clustering is observed. The graph in (b) plots the current of the dominant tip (red) over the first 20 min of CCM together with the number of emitting tips (blue) inside of the box. The emission currents of the less dominant tips in the box are indicated as multicolored dots.

