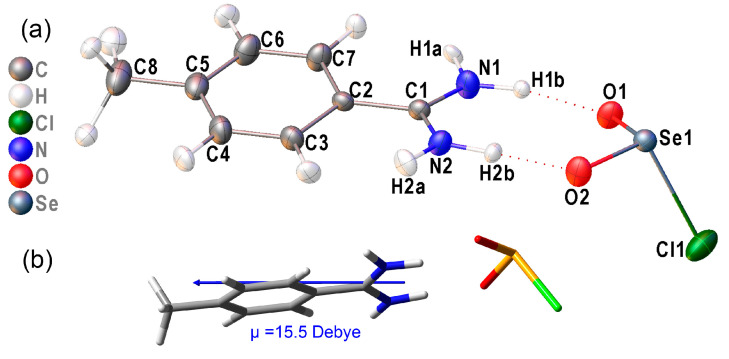
Figure 1.
(a) Displacement ellipsoids plots (50% probability) for the molecular structures of 2 as found in the crystal lattice. The second component of the CH3 rotational disorder model is omitted. H-bonds are shown with red dotted lines. (b) Tubes plot, showing the DFT-computed dipole moment (blue vector; IUPAC convention) of an isolated ion pair in 2 from an RB3PW91-D3/aug-CC-pVTZ calculation.

