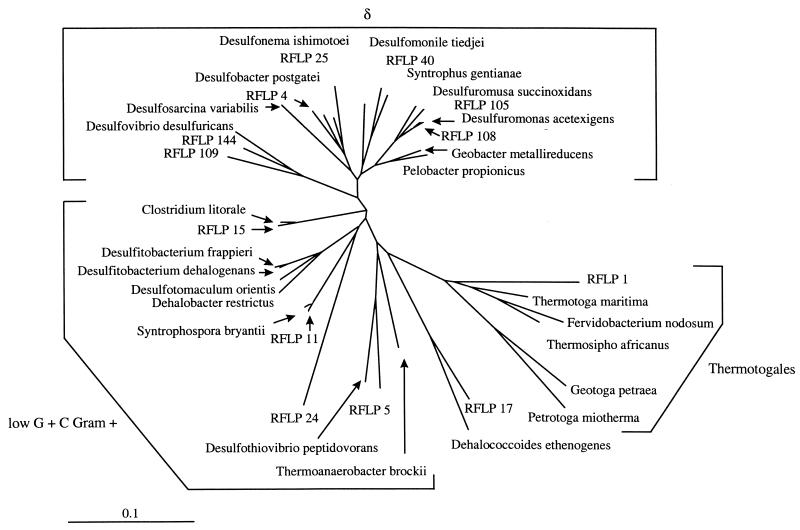
FIG. 5.
Phylogenetic tree inferred from comparative sequence analyses of partial 16S rDNA sequences from several predominant clones obtained from PCB-ortho-dechlorinating enrichment cultures. For construction of a phylogenetic tree, approximately 890-bp segments of selected sequences were aligned manually with a collection of known bacterial 16S rRDAs (for nucleotide sequence accession numbers, see Materials and Methods) obtained from the GenBank database by using software described by Chun (7). Evolutionary distances, expressed as estimated changes per 100 nucleotides, were calculated from the percentages of similarity by using the correction of Jukes and Cantor (18). A dendogram was constructed with PHYLIP based on the unweighted pair group method with arithmetic averages (15). The bar represents 0.1 U of evolutionary distance.

