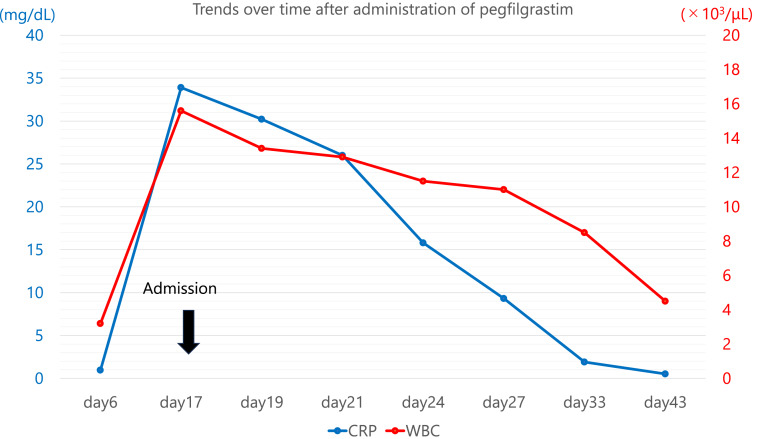
Fig. 2.
Line graph of trends in white blood cell (WBC) counts and C-reactive protein (CRP). The blue line indicates the trend in CRP levels, and the red line indicates the trend in WBC counts. Both CRP level and WBC count were abnormally high on the 17th day after PEG-G-CSF administration. However, they continued to decrease without corticosteroid administration and were almost normalized on the 33rd day of PEG-G-CSF administration.

