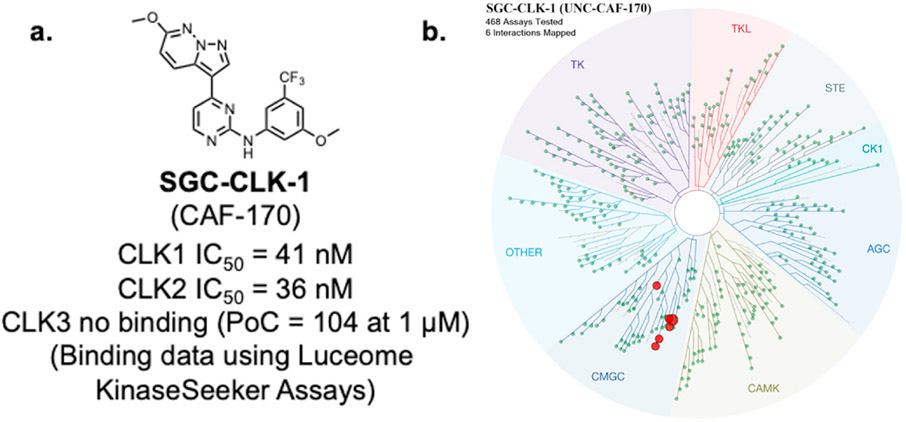
Fig. 1.
CLK probe SGC-CLK-1 and kinase selectivity: a. SGC-CLK-1 structure and binding activity values from KinaseSeeker assays (Luceome) b. SGC-CLK-1 KINOMEscan® selectivity data visualized on the kinase phylogenetic tree (see supplemental Excel file for complete KinomeScan data). All kinases with PoC values < 35 are depicted on the tree as red dots. Image generated using TREEspot™ Software Tool and reprinted with permission from KINOMEscan®, a division of DiscoveRx Corporation, © DISCOVERX CORPORATION 2010.

