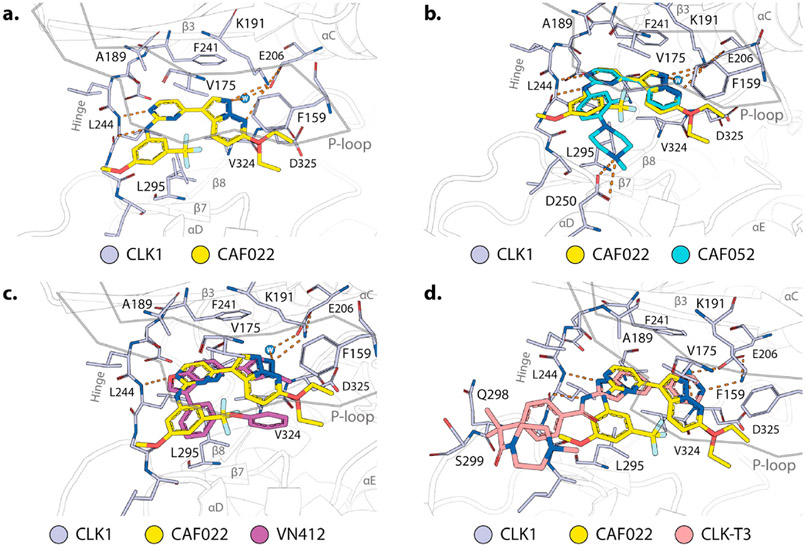
Fig. 4. Structural analysis of CAF022 in comparison with other CLK inhibitors.
a. Crystal structure of the CLK1 (gray)-CAF022 (yellow) complex (pdb 6ZLN). Highlighted are amino acids of CLK1 that directly interact with CAF022. Hydrogen bonds are indicated by orange dashes. For the ethyl ether of CAF022 two alternative conformations were modeled. b-d. Overlay of the binding modes of CAF022 (yellow) and b. CAF052 (cyan, pdb 7AK3), c VN412 (magenta, pdb 6I5H), or d. CLK-T3 (red, pdb 6RAA). Structures of the compounds described in this figure along with activity data are in the Supplemental Table S3.

