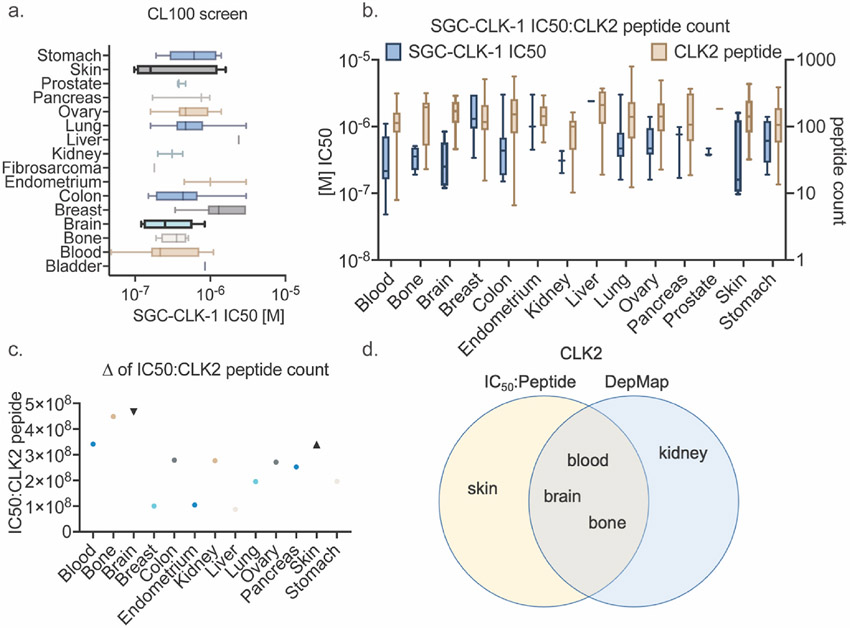
Fig. 5.
a. CL100 screen of denoted cancers by organ to determine IC50 of SGC-CLK-1, b. CCLE quantification of CLK2 peptide abundance (tan boxplot) as compared to IC50 (blue boxplot from 4a) by cancer type, c. ratio of IC50 to CLK2 peptide abundance where a higher score suggests greater CLK2 dependence, d. DepMap and IC50: peptide ratio Venn diagram for overlapping CLK2 dependent cancers.

