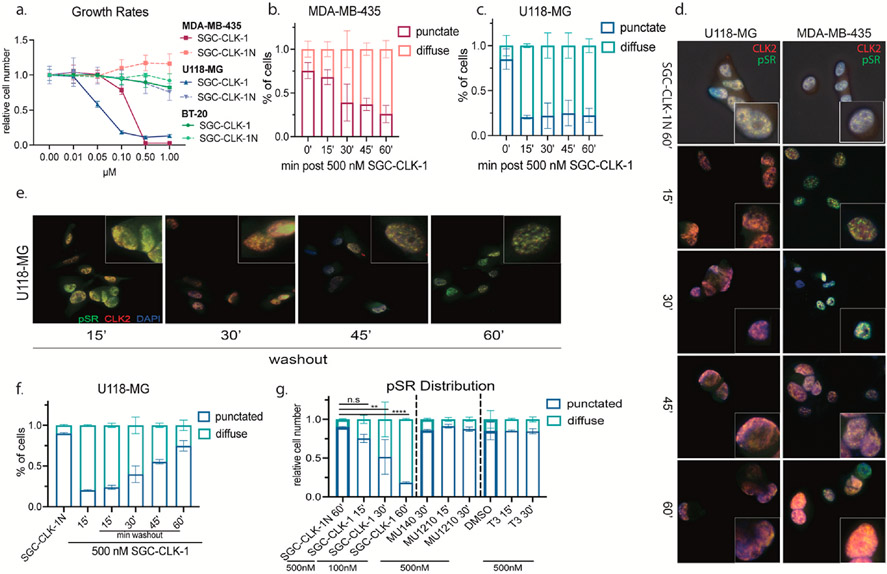
Fig. 6.
a. Crystal violet growth rates of U118-MG, MDA-MB-435, and BT-20 with denoted concentration of SGC-CLK-1 or the negative control SGC-CLK-1N for 7 days. b and c. Immunofluorescent quantification of pSR localization at denoted timepoints and cell lines with 500 nM SGC-CLK-1. d and e. Representative images of c. and f. quantification, respectively, in U118-MG cells. f. IF quantification of pSR localization post conditioned media washout in U118-MG cells. g. pSR localization via IF in denoted CLK inhibitors at either 500 or 100 nM concentrations for the times written. The bold bars depict the negative control for the respective CLK inhibitor.

