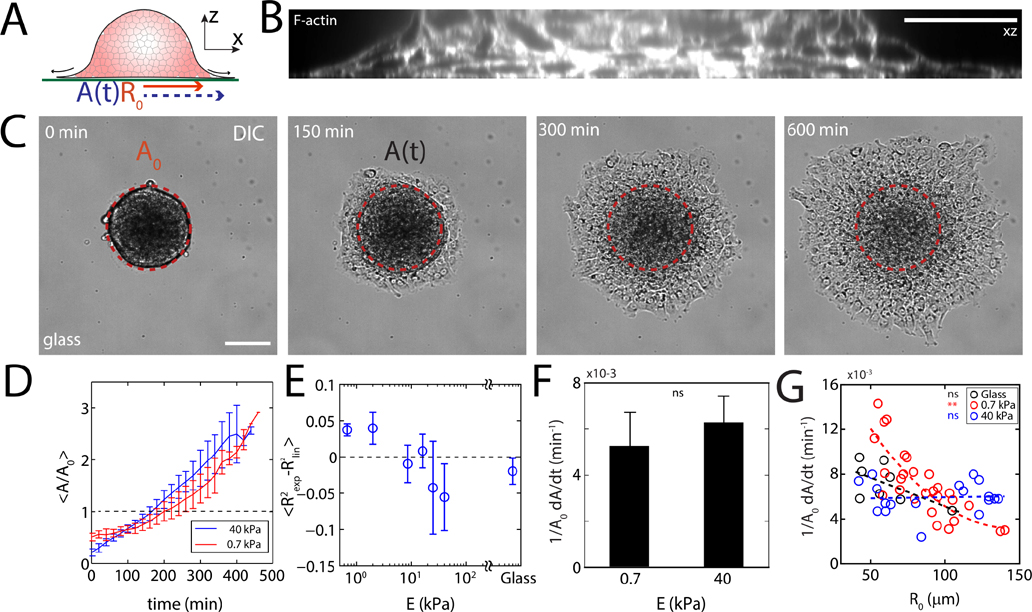
FIG. 1. Substrate stiffness and aggregate size determine wetting dynamics.
(A) Diagram of an aggregate spreading on a fibronectin-coated polyacrylamide gel. (B) z-profile of F-actin stained aggregate adhered to glass. (C) DIC image of an aggregate spreading on glass. is the projected area of an un-deformed aggregate, and A is the instantaneous contact area over which the monolayer has spread. (D) Normalized spread area as a function of time and stiffness. (E) Difference in fitting values as a function of stiffness. (F) Spreading rate measured between and for 0.7 kPa and for 40 kPa). (G) Spreading rate as a function of aggregate size for 0.7 kPa substrate (red, 40 kPa substrate (blue, ), and glass (black, ). Scale bars are . *P < 0.05, **P < 0.01, ***P < 0.001. ns is non-significant. Error bars are mean ± standard deviation.

