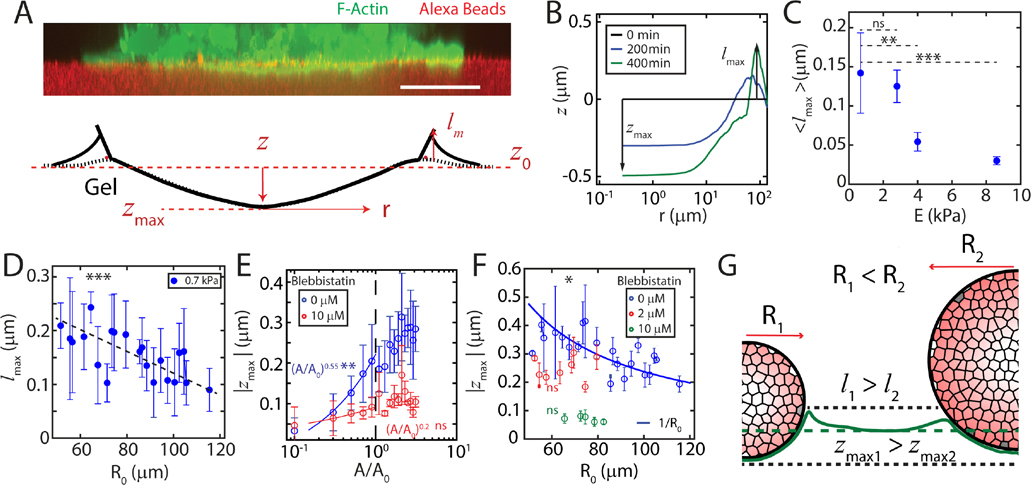
FIG. 3. Aggregate adhesion induces capillary deformations in the substrate.
(A, top) A reconstructed z-slice showing F-actin in a cell aggregate (green) indenting a 0.7 kPa substrate (red). (A, bottom) A schematic showing relative magnitudes of out-of-plane deformations . (B) z-indentation as a function of radial distance from the center of an aggregate. (C) Mean elasto-capillary length for all aggregates, as a function of substrate stiffness, E. The indentation measured at 8.6 kPa corresponds to noise in the measurement of indentation. (D) Meniscus height as a function of aggregate size on . (E) Maximum indentation as a function of scaled contact area, for untreated (blue) and 10 μM Blebbistatin treated (red) aggregates. (F) Maximum indentation, , as a function of aggregate radius, . Pharmacological treatment with Blebbistatin vanishes Laplace-like behavior. , , . (G) Diagram of aggregates of different sizes inducing different out-of-plane deformations. Scale bar is . *P < 0.05, **P < 0.01, ***P < 0.001. ns is non-significant. is set to 0 for all measurements.

