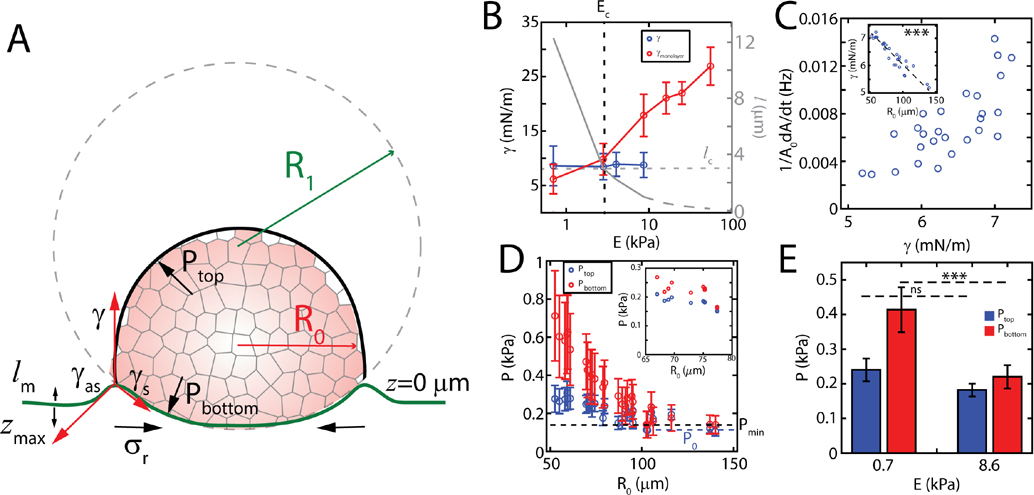
FIG. 4. Capillary forces increase aggregate internal pressure.
(A) A schematic describing the decomposition of forces and pressures at on deformable substrates. (B) Effective surface tension as a function of substrate stiffness when measured from monolayer stress (red), and active elasto-capillary deformations (blue) samples per data point). Effective elasto-capillary length as a function of substrate stiffness calculated from experimental data (solid grey) and under assumption that surface tension stays constant (dashed grey). and are the critical elasto-capillary length and critical substrate stiffness, respectively, where the transition between modes of migration occurs. (C) Aggregate spreading rate as a function of the aggregate surface tension on a 0.7 kPa substrate . Surface tension as a function of aggregate size (inset). (D) Pressure on top and bottom section of an aggregate at 0.7 kPa and 8.6 kPa (inset). The dashed black line represents the minimum pressure, , required to overcome traction. The dashed blue line is basal pressure, , for largest aggregates. Error bars are error propagated from measurements of and . (E) Mean pressure on top and bottom sections as a function of substrate stiffness ( for 0.7 and 8.6 kPa each). Error bars are mean ± standard deviation.

