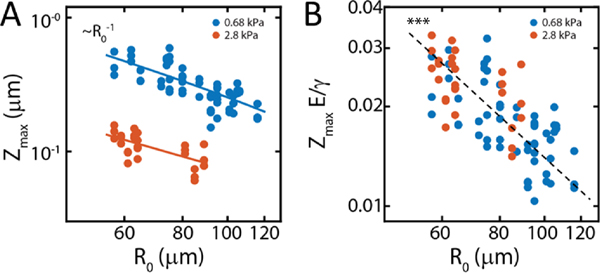
FIG. 7. Indentation follows a decay on substrates of different stiffnesses.
(A) Maximum indentation at as a function of aggregate size and substrate stiffnesses (0.7 kPa and 2.8 kPa). In both cases we observe that the indentation behavior is well approximated by a decay. (B) Maximum indentation scaled by elasto-capillary length scale, as function of size . Collapse of the data to a single regime indicates that indentation is proportional to elasto-capillary length. Each point represents a single experiment.

