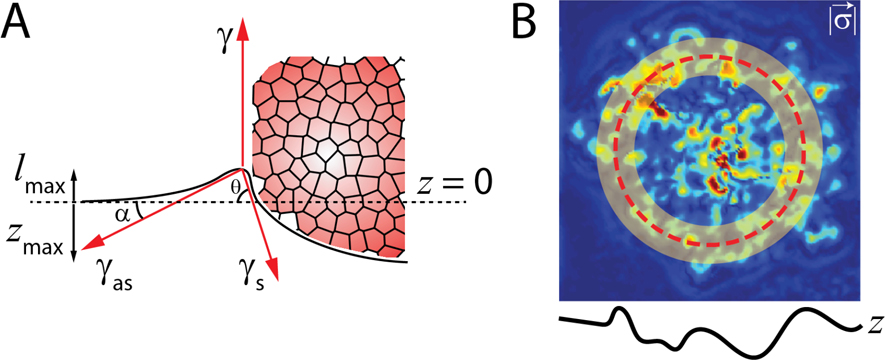
FIG. 8. Estimation of Aggregate surface tension from 3D deformation data:
(A) A schematic showing force balance at the meniscus. The surface tension of the adhered aggregate was estimated by measuring the z-indentation, meniscus height, and radial traction forces. is the tension at the aggregate-media interface, is the tension at the substrate-media interface, is the tension at the substrate-aggregate interface. (B) Traction forces are calculated in the transparent yellow circular region of the TFM maps. Red dashed line show . The width of yellow region is 25 μm.

