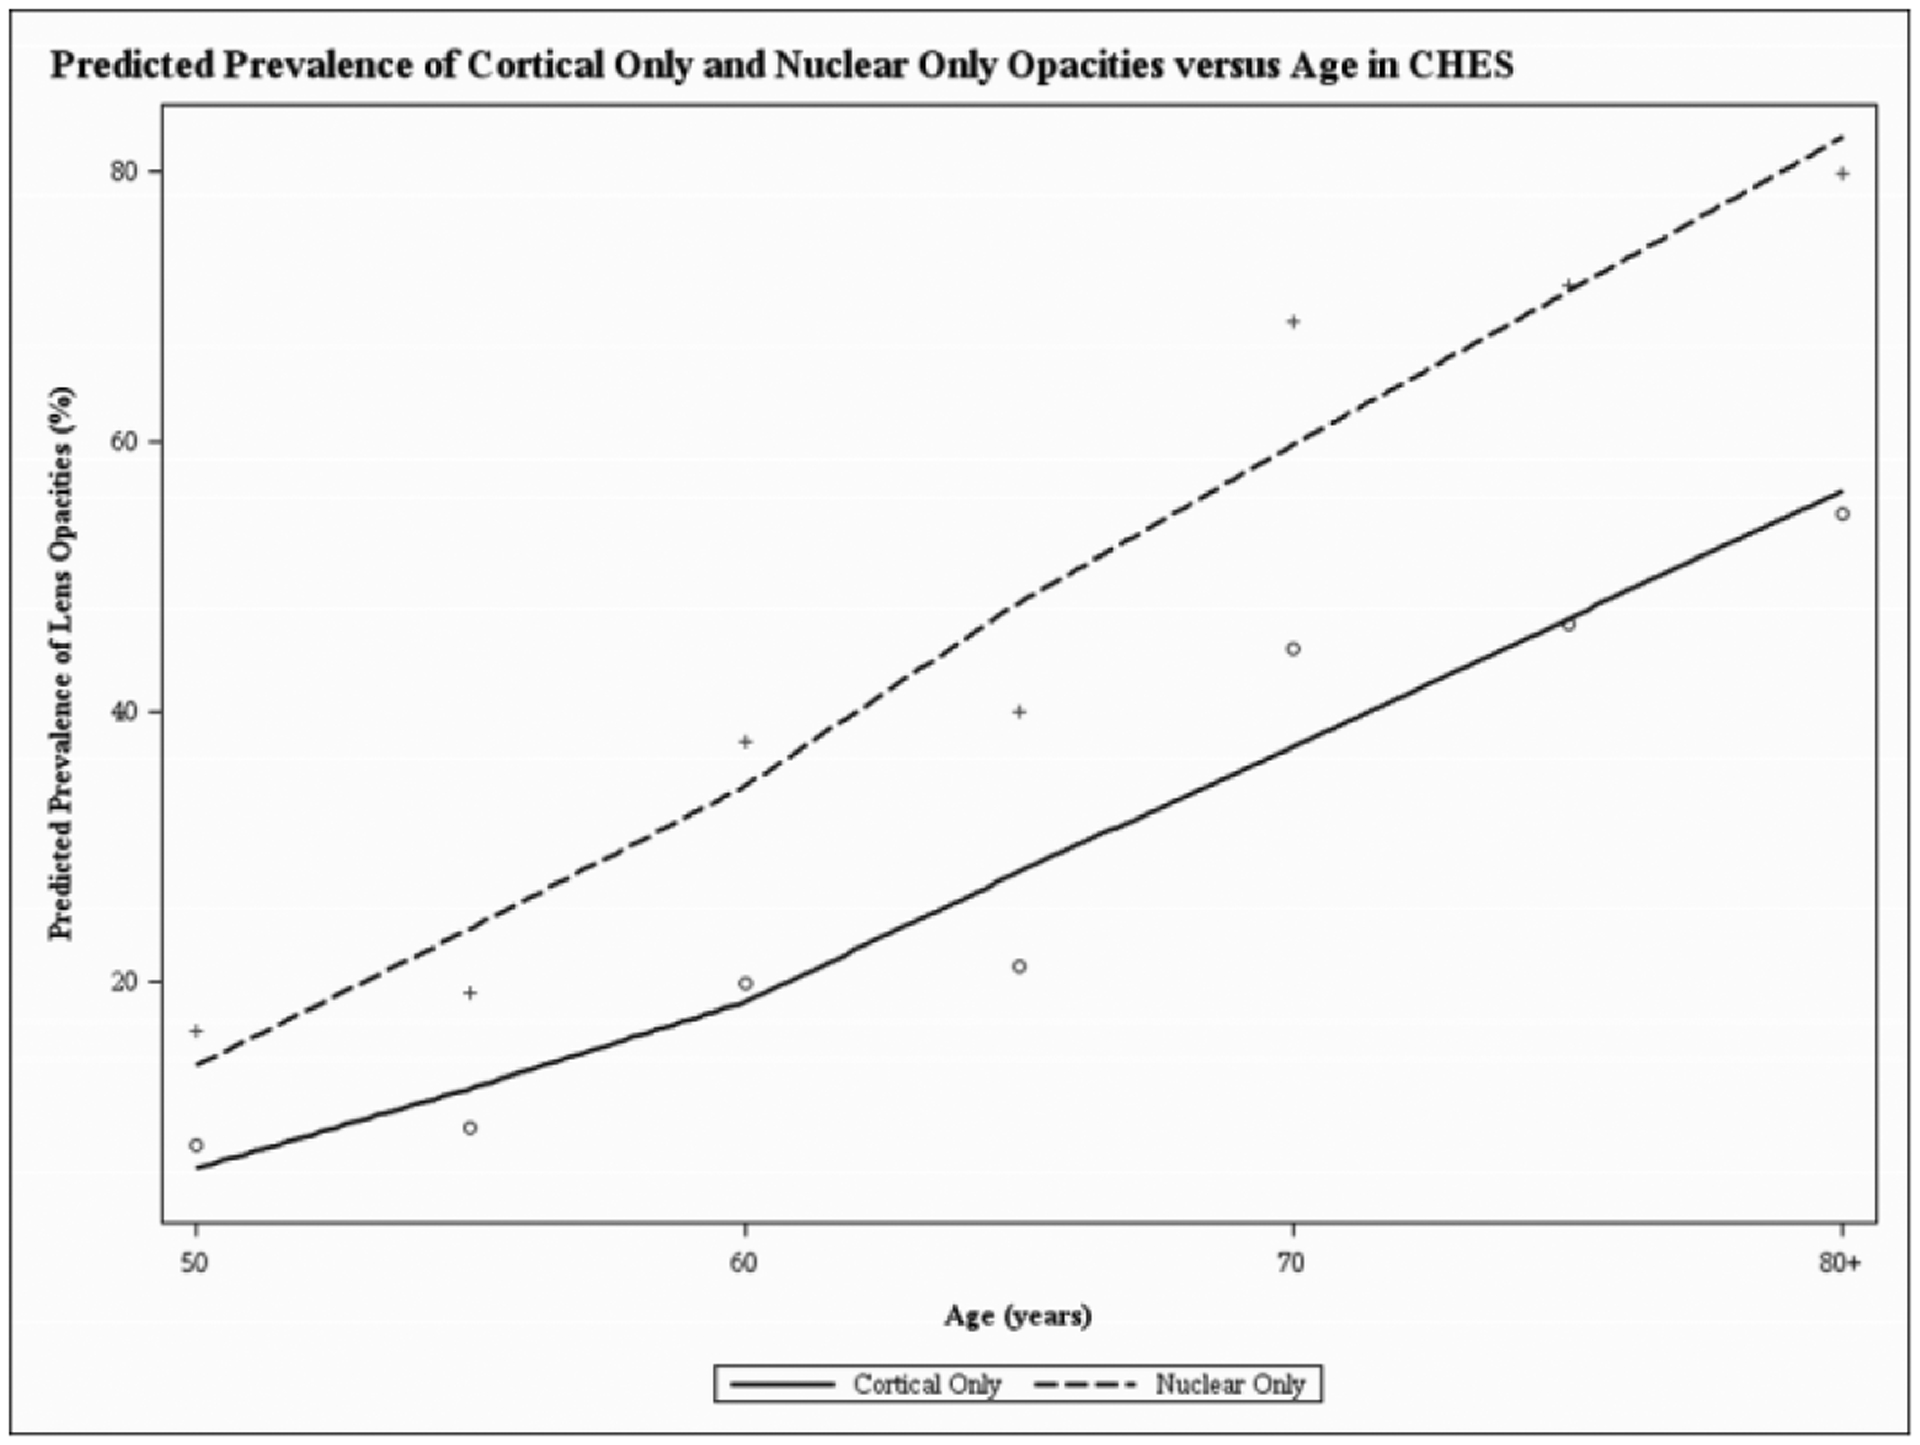
Figure 1.

Locally weighted scatterplot smoothing regression (LOWESS) plot characterizing the independent relationship between age (in years) and predicted prevalence of cortical and nuclear opacities, after adjusting for covariates, in the Chinese American Eye Study (CHES). The final adjusted model for cortical-only opacities included the following covariates: age, sex, height, family history of cataract and diabetes mellitus. The final adjusted model for nuclear-only opacities included the following covariates: age, sex, marital status, alcohol consumption, weight, waist-to-hip ratio, diabetes mellitus and high-density lipoprotein.
