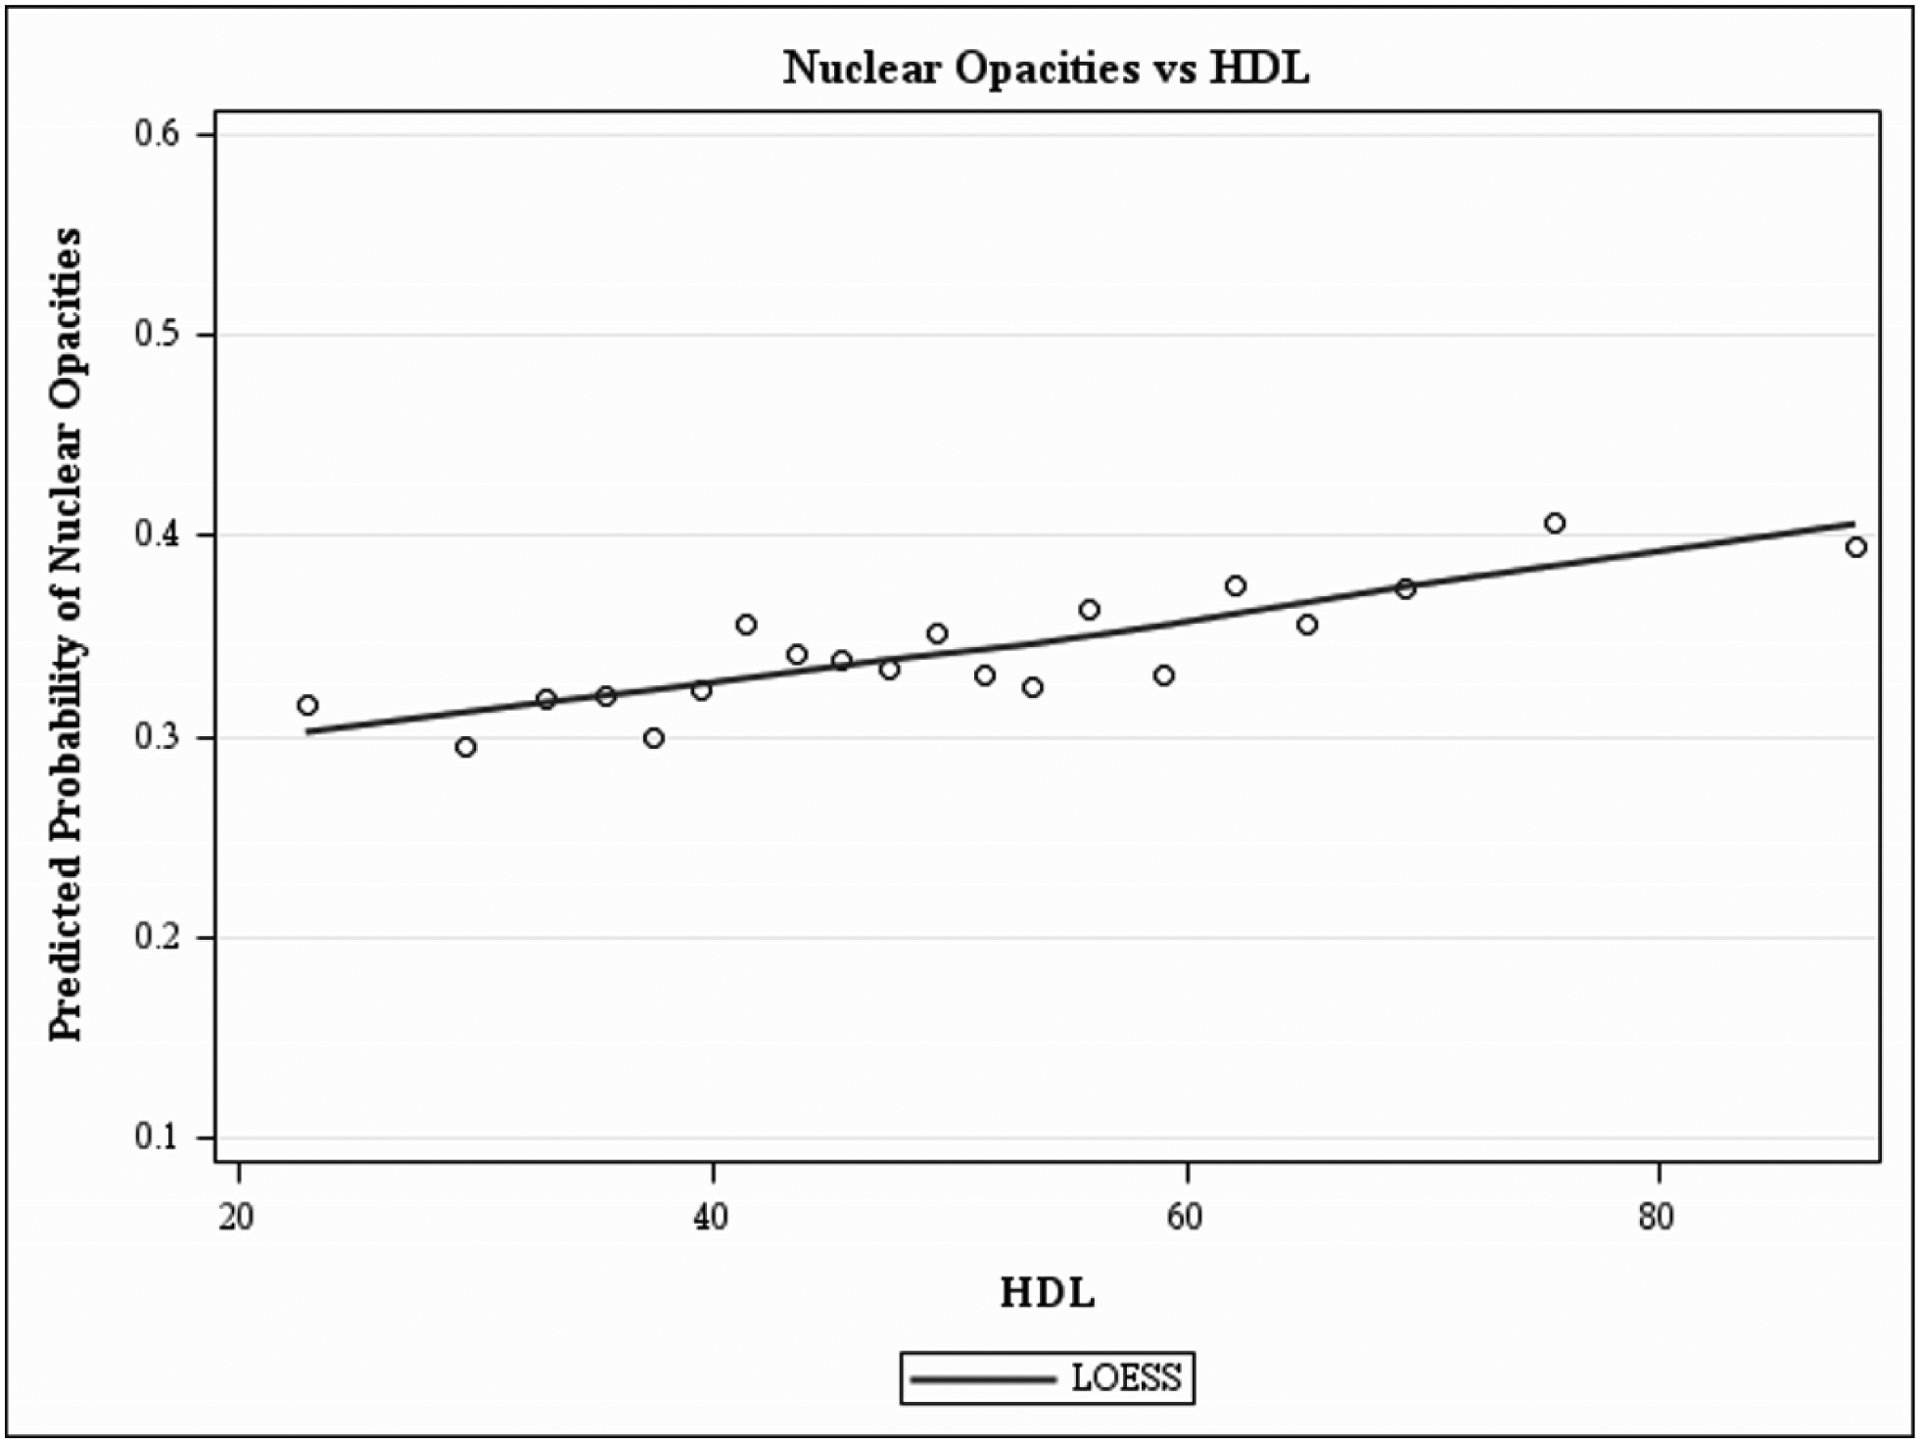
Figure 3.

Locally weighted scatterplot smoothing regression (LOWESS) plot characterizing the independent relationship between HDL (mg/dl) and predicted prevalence of nuclear opacities after adjusting for covariates, in the Chinese American Eye Study (CHES). The final adjusted model for nuclear-only opacities included the following covariates: age, sex, marital status, alcohol consumption, weight, waist-to-hip ratio, diabetes mellitus and high-density lipoprotein.
