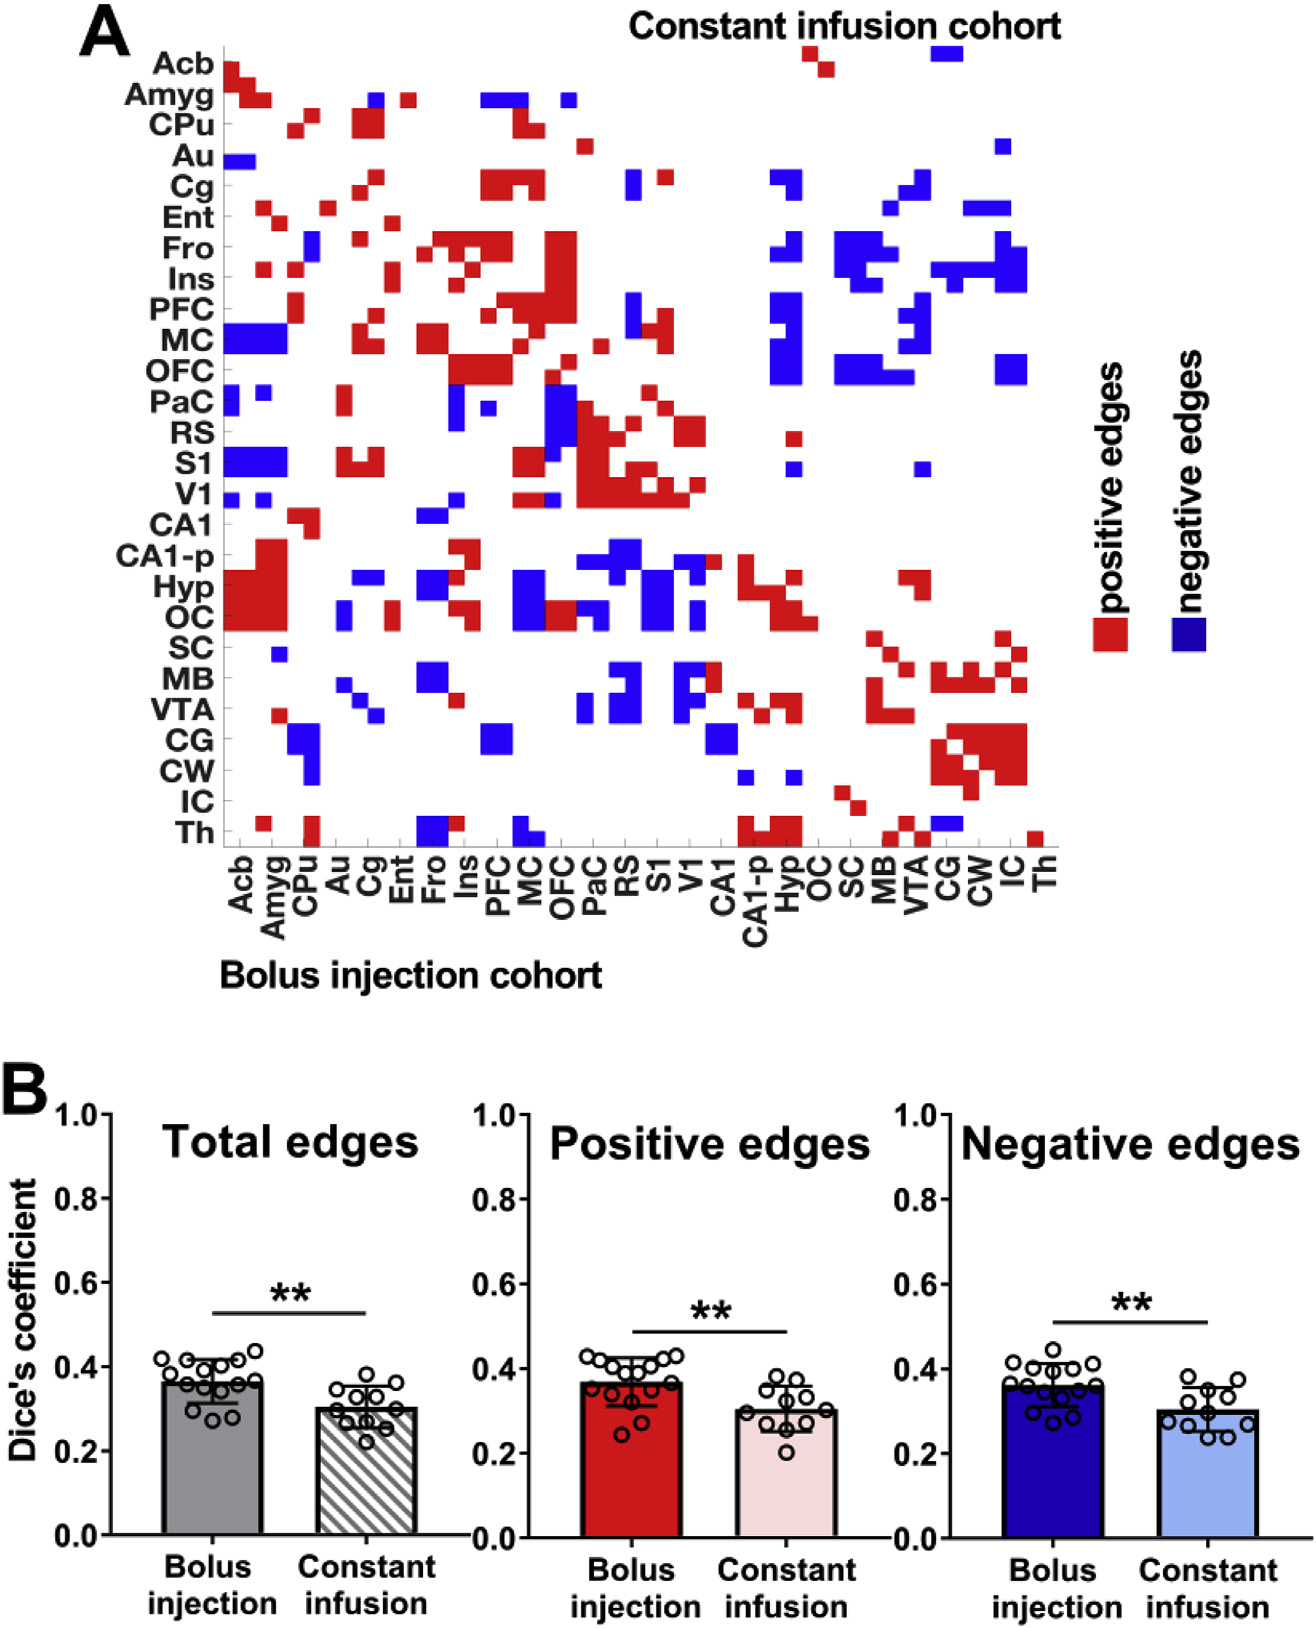
Fig. 2. Correlation synchrony based on fMRI and dynamic PET data.

(A) Tertiary group-mean matrices of the bolus injection cohort versus the constant infusion cohort indicate common functional and dynamic [18F]FDG-PET correlations; red shows common positive edges (r > 0.25) and blue shows common negative edges (r < −0.25). (B) Dice coefficients indicate similarities for total, positive and negative edges between weighted group-mean functional and dynamic [18F] FDG-PET correlations in both cohorts. The respective brain ROIs and their abbreviations are listed in Supplementary Table 1. Bolus injection cohort (N = 15); constant infusion cohort (N = 11). The error bars represent standard deviations. ** represents p-values < 0.01.
