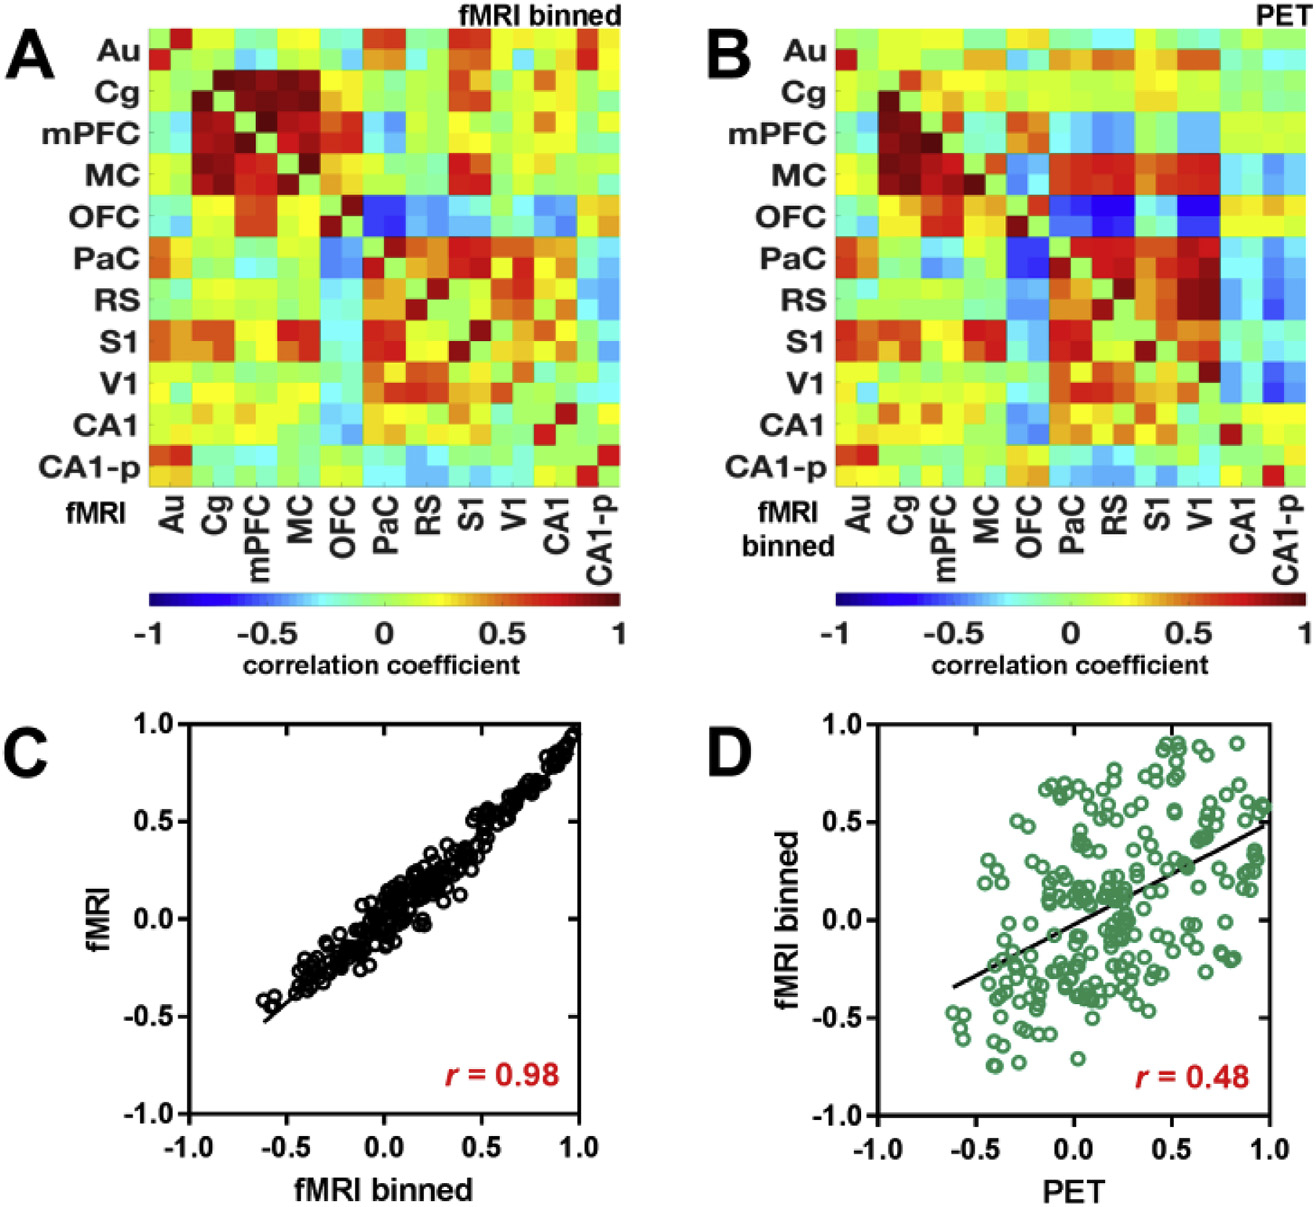
Fig. 4. Temporal synchronization of fMRI and PET data.

fMRI time course data of the bolus injection cohort were binned to the temporal resolution of the PET data (1 min) and Pearson’s r correlation coefficient matrices were computed for the DMN-like structure. Resulting matrices were compared to (A) the original fMRI data and the (B) the [18F]FDG-PET data. Scatter plots of pair-wise correlations between brain regions (averaged across subjects) containing the DMN-like structure and linear fits were computed for (C) the comparison between original fMRI and binned fMRI data, as well as for (D) the comparison between binned fMRI and [18F]FDG-PET data. The correlation value represents Pearson’s correlation coefficient r. The different brain ROIs containing the DMN-like structure and their abbreviations are listed in Supplementary Table 2. (N = 15).
