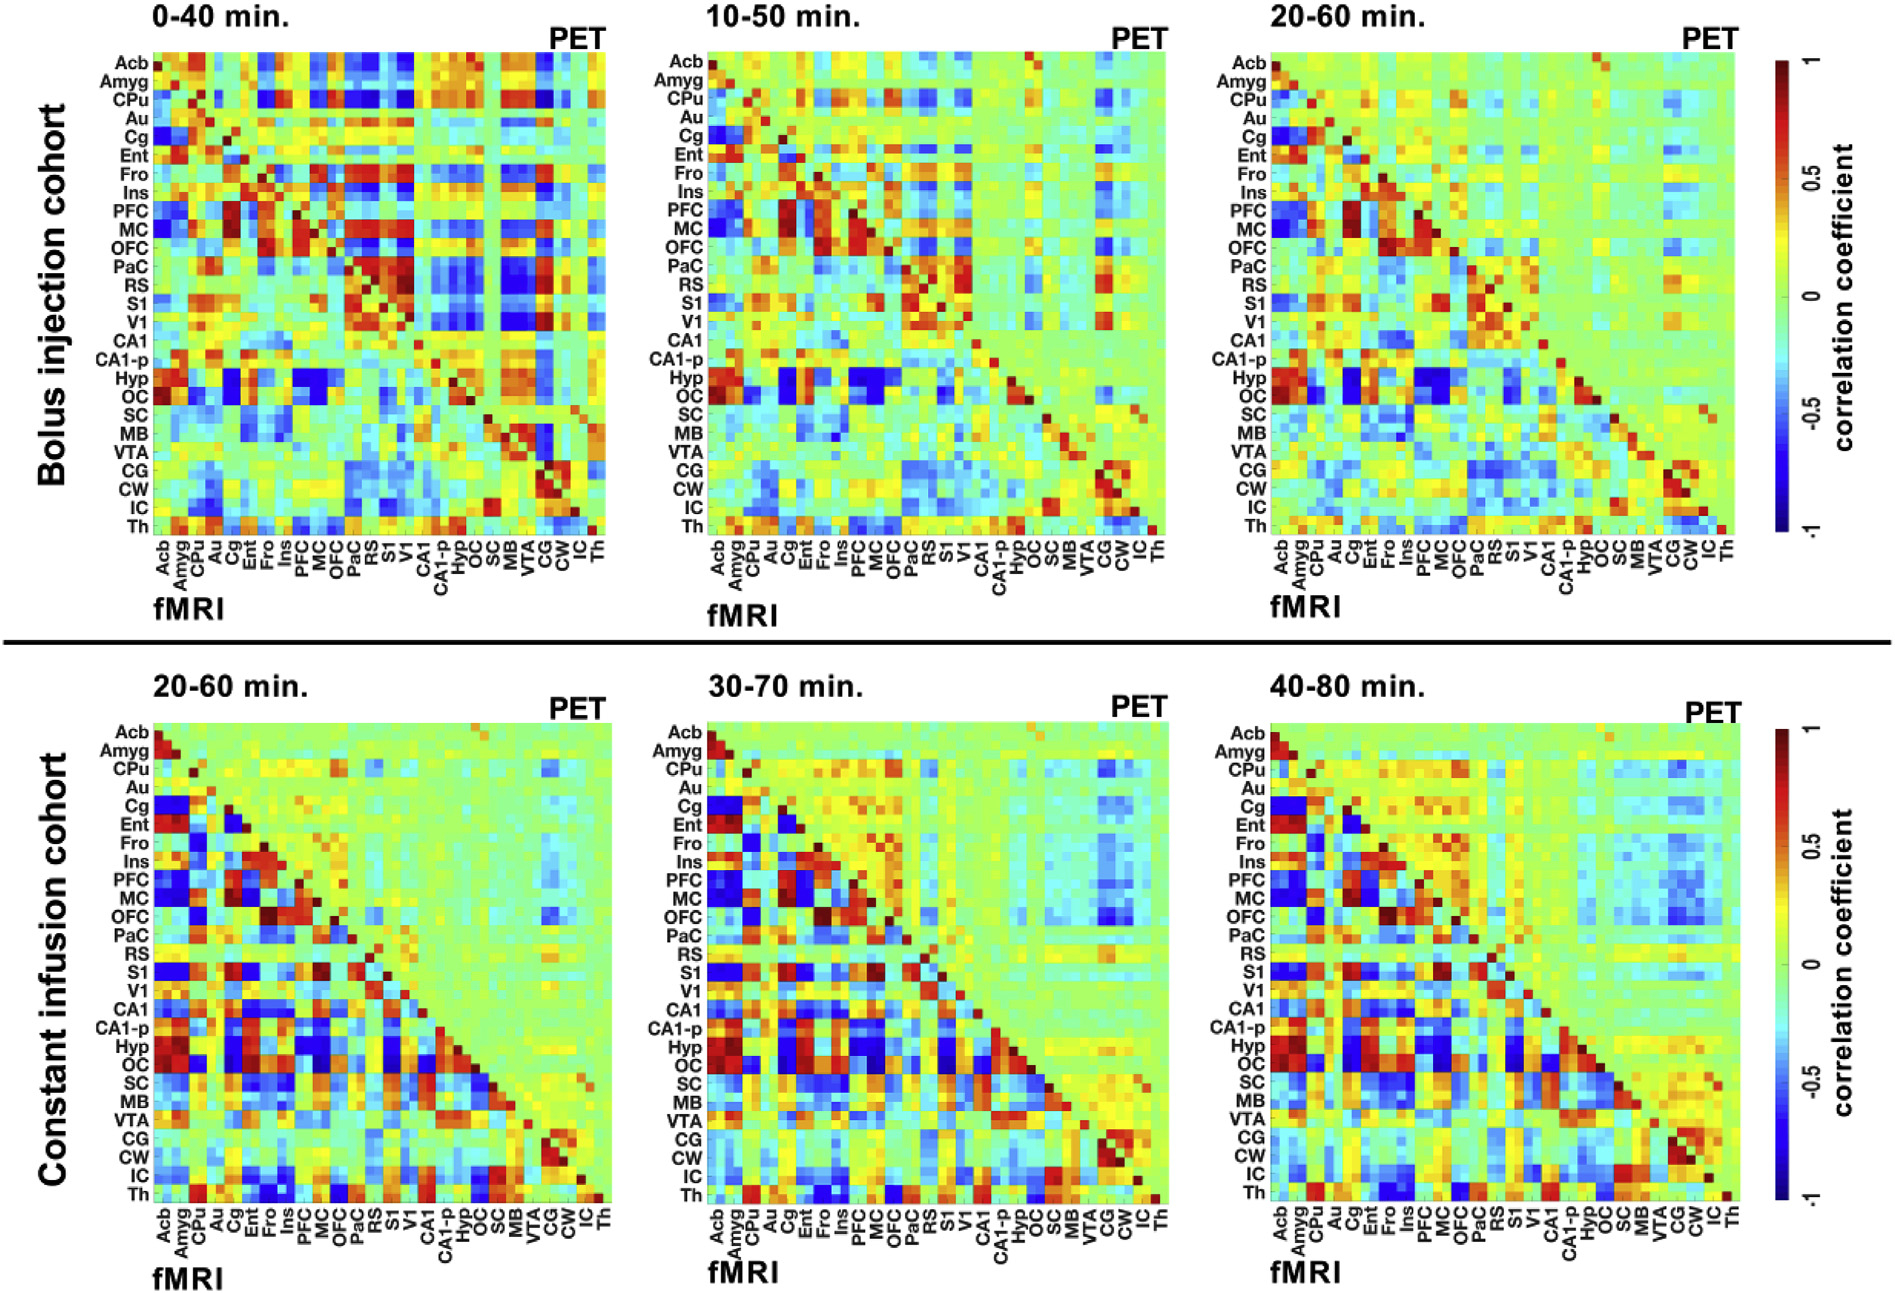
Fig. 5. Dynamic [18F]FDG-PET connectivity.

Pearson’s r correlation coefficient matrices were computed for the fMRI and [18F]FDG-PET data of the bolus injection and constant infusion cohorts at three different time intervals of 40 min (bolus injection cohort: 0–40 min, 10–50 min, and 20–60 min; constant infusion cohort: 20–60 min, 30–70 min, and 40–80 min). The color scale represents the strengths of correlations. Correlation coefficients with p-values ≥ 0.05 were set to 0. The different brain ROIs and their abbreviations are listed in Supplementary Table 1 p ≥ 0.05. Bolus injection cohort (N = 15); constant infusion cohort (N = 11).
