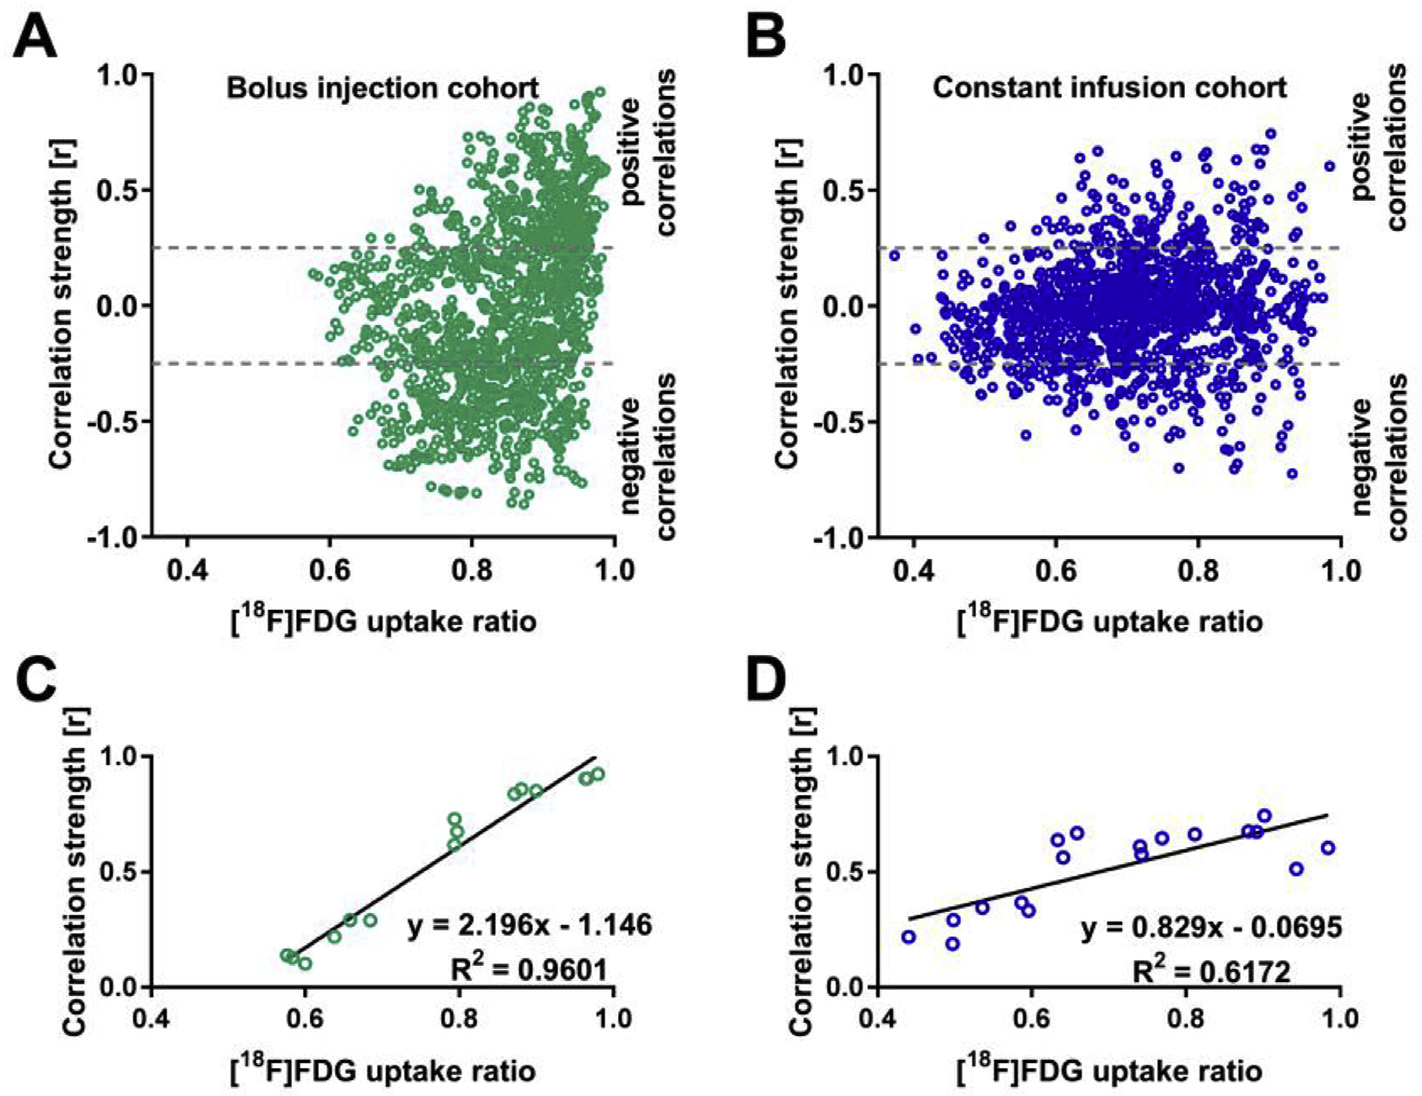
Fig. 7. [18F]FDG-PET correlation strength is tracer uptake-dependent.

The dependencies of correlation coefficient strengths on the [18F]FDG uptake ratios of the respective brain areas are shown in scatter plots for the bolus injection cohort (A) and the constant infusion cohort (B). The three highest positive correlations for six [18F]FDG uptake ratio intervals (0.40–0.50, 0.50–0.60, 0.60–0.70, 0.70–0.80, 0.80–0.90, and 0.90–1.00) were selected for linear regression analysis for (C) the bolus injection and (D) constant infusion cohorts. Bolus injection cohort (N = 15); constant infusion cohort (N = 11).
