
Fig. 3.
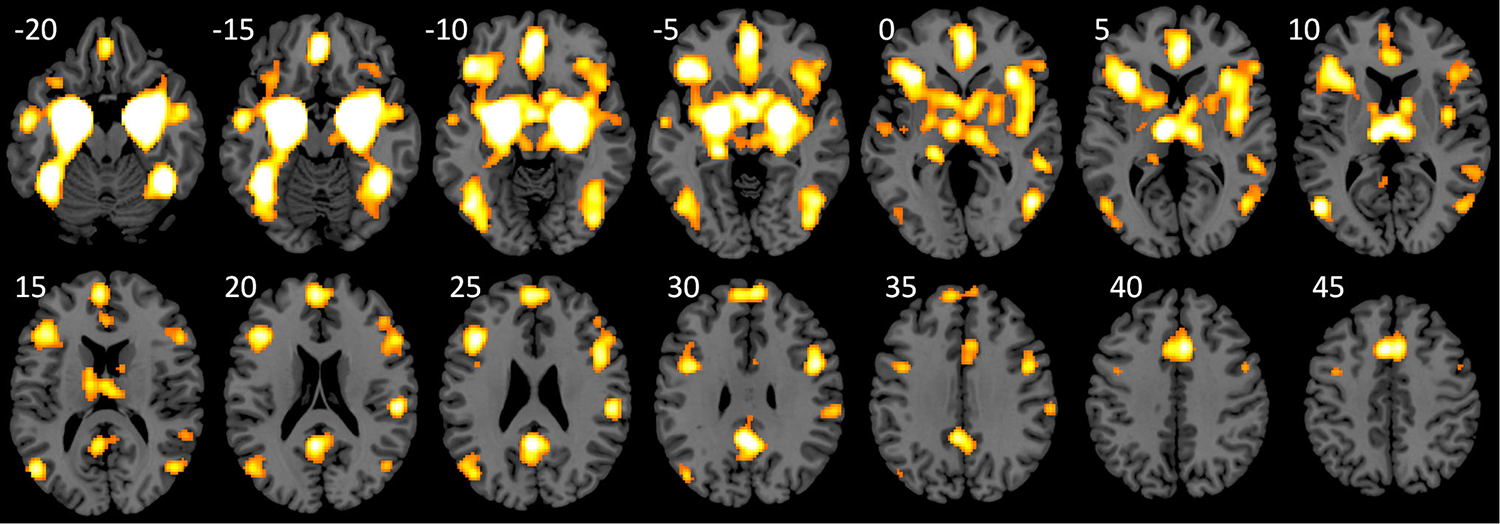
Regions that showed coactivations with the amygdala. The activation likelihood map was approached at uncorrected p < 0.01 and a cluster-level p < 0.05. Numbers near each slice represent MNI (Montreal Neurological Institute) z coordinates
Official websites use .gov
A
.gov website belongs to an official
government organization in the United States.
Secure .gov websites use HTTPS
A lock (
) or https:// means you've safely
connected to the .gov website. Share sensitive
information only on official, secure websites.
Regions that showed coactivations with the amygdala. The activation likelihood map was approached at uncorrected p < 0.01 and a cluster-level p < 0.05. Numbers near each slice represent MNI (Montreal Neurological Institute) z coordinates