Figure 8.

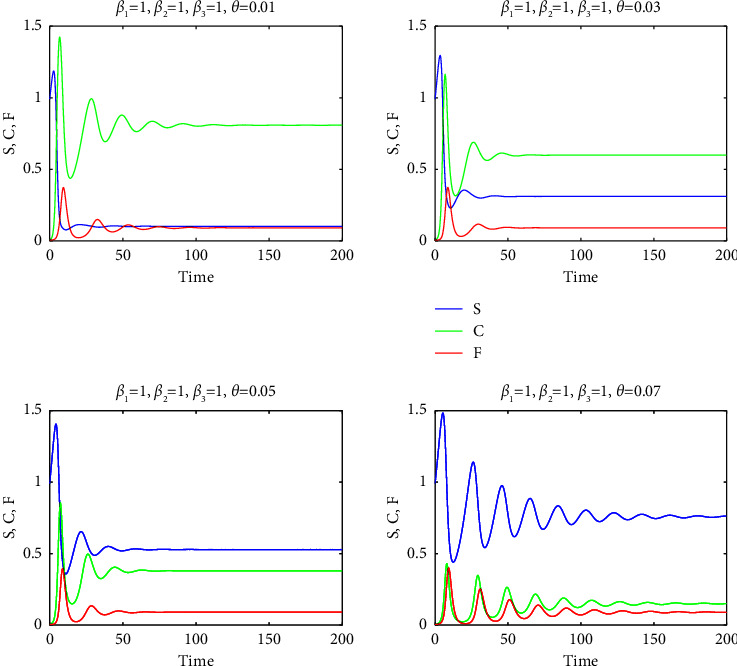
The graphs of S (blue curves), C (green curves), and F (red curves) as a function of t for β2=β3=1 and for θ=0.01,0.03,0.05,0.07.

The graphs of S (blue curves), C (green curves), and F (red curves) as a function of t for β2=β3=1 and for θ=0.01,0.03,0.05,0.07.