
Figure 9.
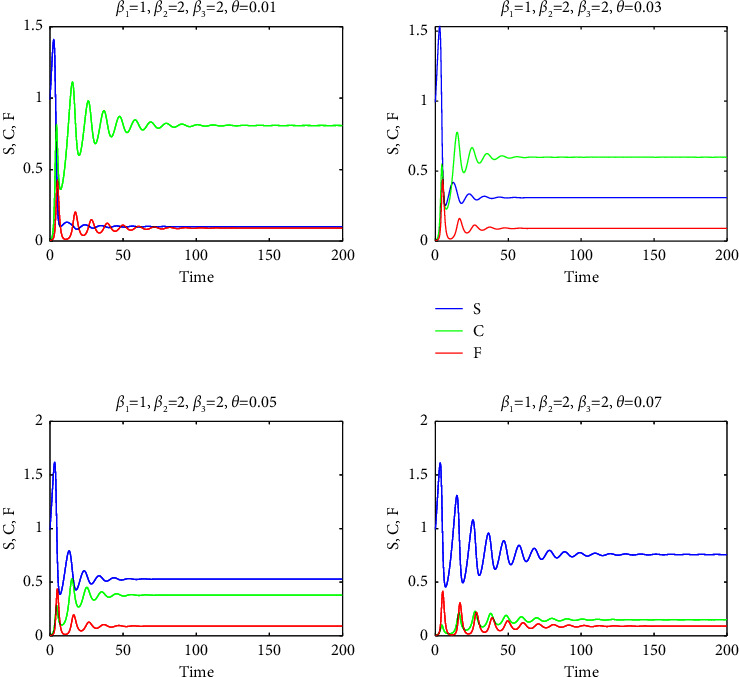
The graphs of S (blue curves), C (green curves), and F (red curves) as functions of t for β2=β3=2 and for θ=0.01,0.03,0.05,0.07.
Official websites use .gov
A
.gov website belongs to an official
government organization in the United States.
Secure .gov websites use HTTPS
A lock (
) or https:// means you've safely
connected to the .gov website. Share sensitive
information only on official, secure websites.
The graphs of S (blue curves), C (green curves), and F (red curves) as functions of t for β2=β3=2 and for θ=0.01,0.03,0.05,0.07.