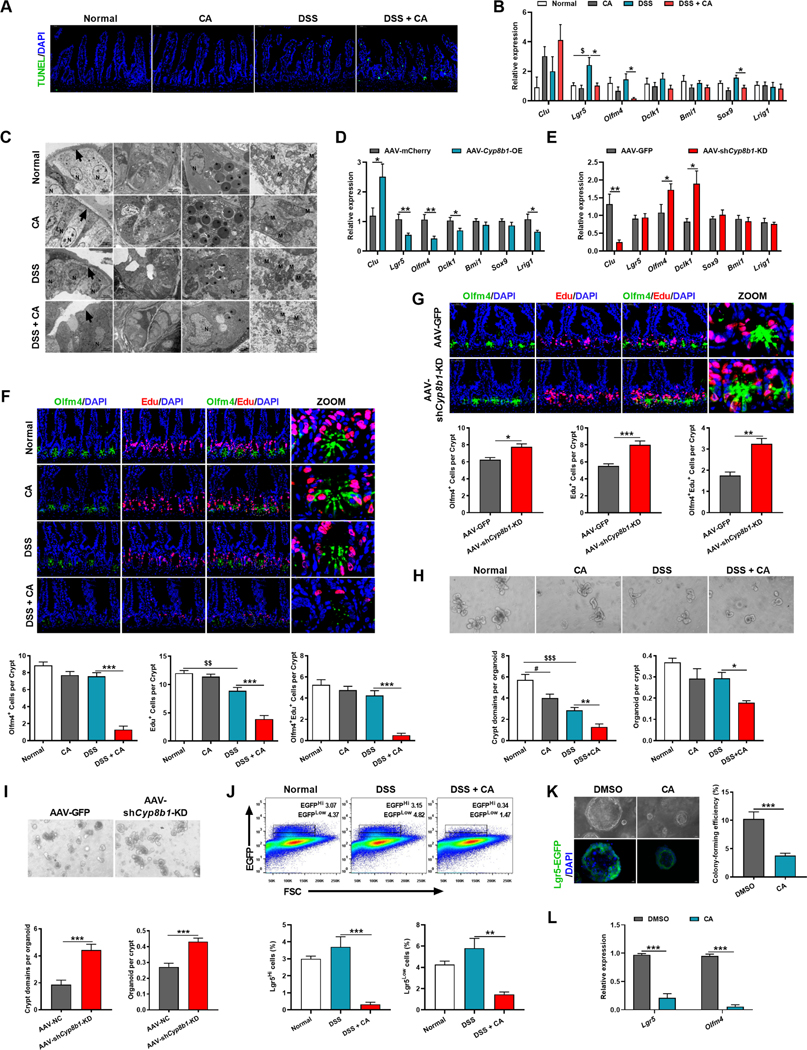
Figure 4. CA treatment reduces Lgr5+ intestinal stem cells and dampens epithelial regeneration.
(A) Representative TUNEL staining of intestinal sections of CA-treated colitic mice.
(B-D) mRNAs of indicated genes in intestine of CA-treated colitic mice (B, n = 5 mice/group), AAV-Cyp8b1-OE colitic mice (C, n = 5–6 mice/group) and AAV-shCyp8b1-KD colitic mice (D, n = 8 mice/group).
(E) Representative TEM of intestinal epithelial layer (arrows: epithelium, N: nucleus, asterisks: mucus and eosinophil cytoplasmic granules, M: mitochondria) in CA-treated colitic mice. (F and G) Representative Edu and Olfm4 staining and quantitation in intestine of CA-treated colitic mice (F) and AAV-shCyp8b1-KD colitic mice (G). n = 5 mice/group.
(H and I) Representative images and quantitation of the crypts isolated from CA-treated colitic mice (H) and AAV-shCyp8b1-KD colitic mice (I) in primary cultures (n = 5 mice/group).
(J) Representative FACS plots of Lgr5-EGFP+ cells in the crypts of CA-treated colitic mice (n = 3 mice/group).
(K and L) Representative images and colon-forming efficiency (K) and Lgr5 and Olfm4 mRNA expression (L) of isolated Lgr5+ ISCs cultured for 6 days (n = 6 biological replicates/group).
Scale bars, 50 μm (A, F, G), 100 μm (H, I, K). (B-D, F-L) Mean ± SEM. (B, F, H, J) One-way ANOVA with Dunnett’s post hoc test. (C, D, G, I, K, L) Unpaired Student’s t-test. */$ P < 0.05; **/$ $ P < 0.01; *** P < 0.001. See also Figure S4.

