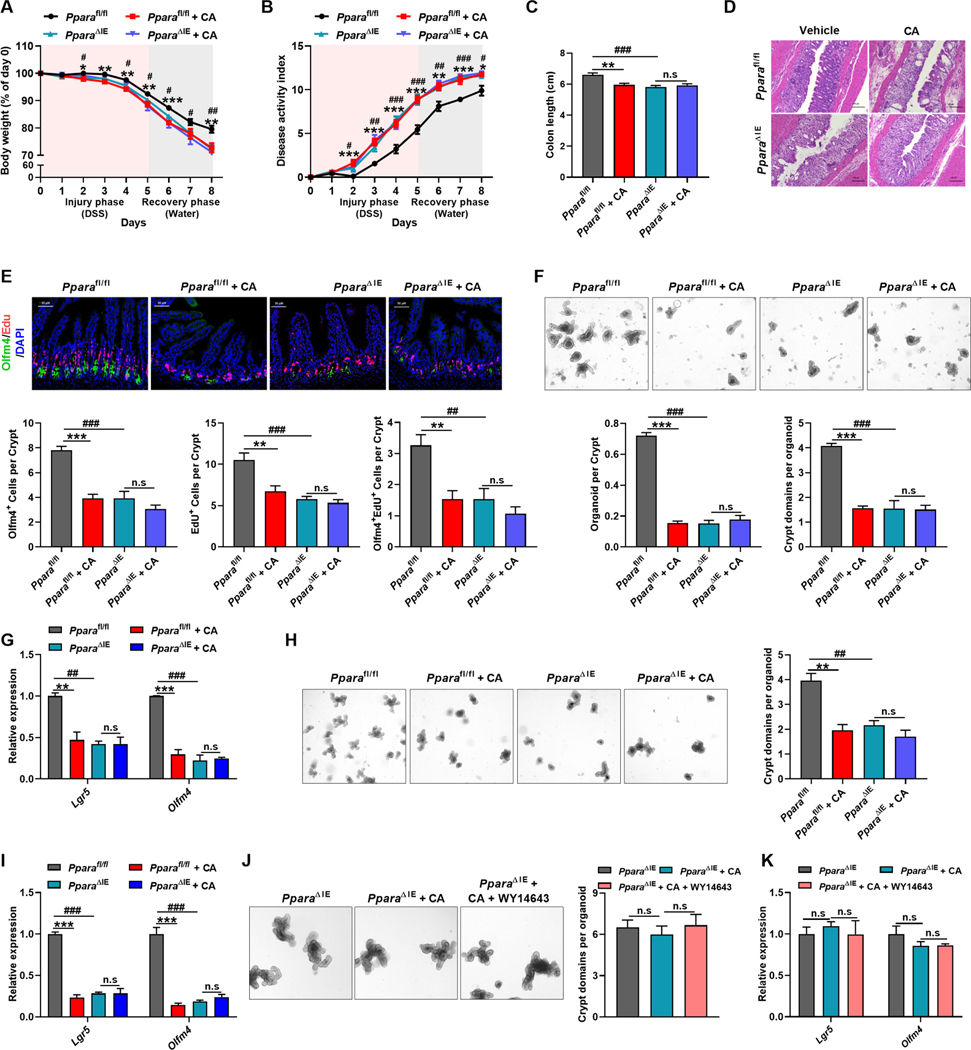
Figure 6. The impairment of CA on intestinal barrier function is dependent on PPARα.
(A-I) Pparafl/fl and PparaΔIE mice were treated with DSS for 5 days followed by 3 days of water together with vehicle or CA. Body-weight loss (A), DAI (B), colon length (C), representative H&E staining of intestine sections (D), representative Edu and Olfm4 staining and quantitation in intestine (E), representative images and quantitation of the intestinal crypts and mRNAs of indicated genes of crypts in primary (F and G) and secondary (H and I) culture. (A-C) n = 8–9 mice/group. (E) n = 5 mice/group. (F-J) n = 3 mice/group.
(J and K) Representative images and quantitation (J, n = 3 biological replicates/group) and mRNAs of indicated genes (K, n = 4 biological replicates/group) of crypts from PparaΔIE mice cultured with indicated treatments for 6 days.
Scale bars, 50 μm (E), 100 μm (D, F, H, J). (A-C, E-K) Mean ± SEM. One-way ANOVA with Dunnett’s post hoc test. *, Pparafl/fl + CA vs Pparafl/fl; #, PparaΔIE vs Pparafl/fl. */# P < 0.05; **/## P < 0.01; ***/### P < 0.001.

