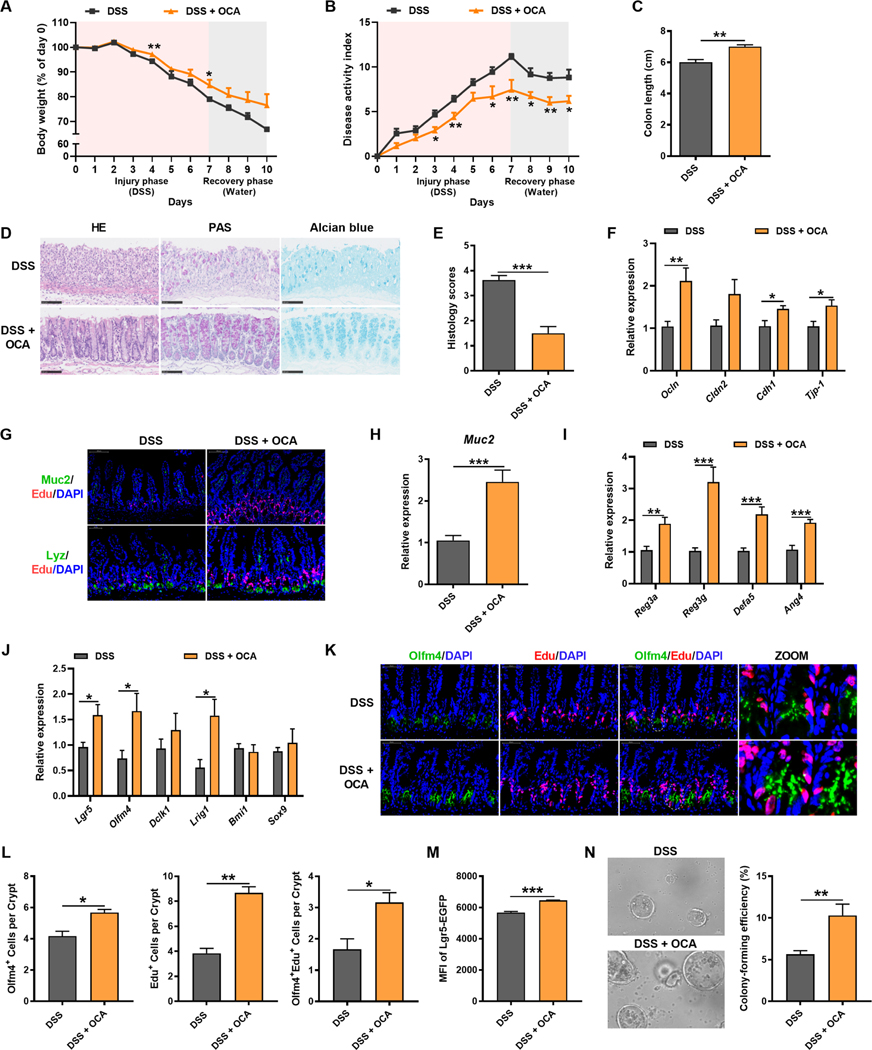
Figure 7. OCA treatment alleviates colitis in mice by improving epithelial mucosal barrier function.
Mice were treated with DSS for 7 days followed by 3 days of water together with vehicle or OCA.
(A) Body-weight loss. (B) DAI. (C) Colon length. (D) Representative H&E, PAS and Alcian blue staining of intestine sections. (E) Histology score. (F, H-J) mRNAs of indicated genes in intestine. n = 7–9 mice/group. (G) Representative Muc2 or Lyz with Edu staining of intestine sections. (K and L) Representative Edu and Olfm4 staining and quantitation in intestine (n = 5 mice/group). (M) The statistics of Lgr5-EGFP MFI (M, n = 3 mice/group) and representative images and colon-forming efficiency of Lgr5Hi cells in the crypts (N, n = 5 mice/group) from colitic Lgr5-EGFP-IRES-creERT2 mice treated with vehicle or OCA.
Scale bars, 100 μm (D, G, N), 50 μm (K). (A-C, E, F, H-J, L-N) Mean ± SEM. Unpaired Student’s t-test. * P < 0.05; ** P < 0.01; *** P < 0.001. See also Figure S7.

