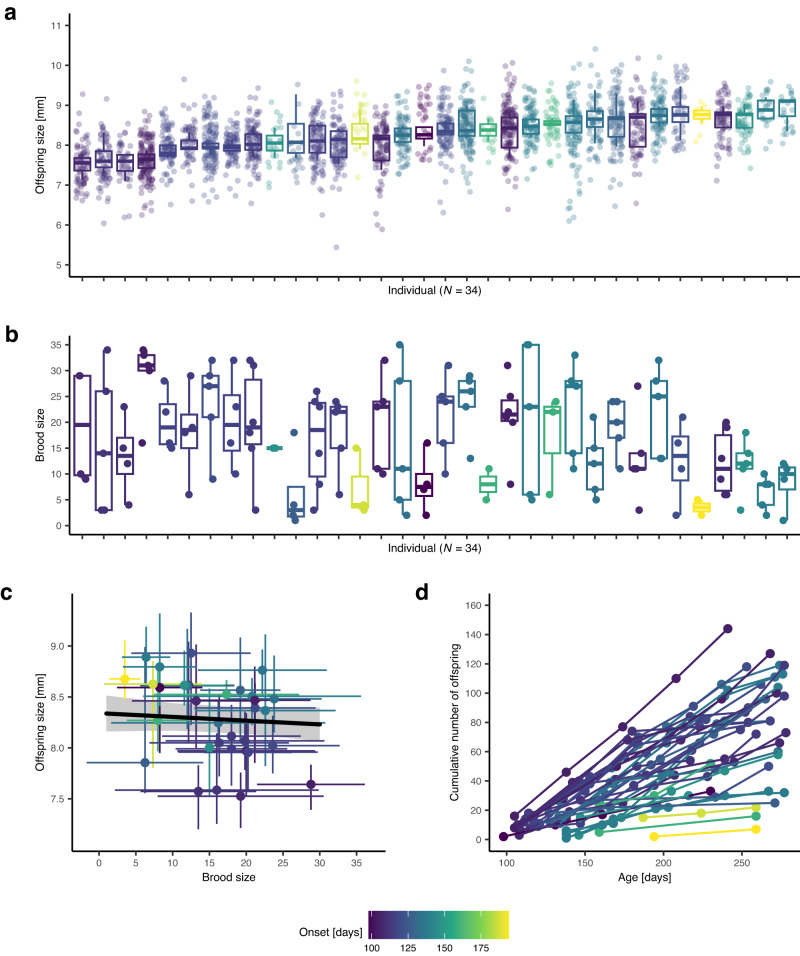
Fig. 1. Reproductive individuality.
a, b Individuals (N = 34) differ consistently in the size and number of offspring produced over successive broods (we recorded 152 broods and measured N = 2522 offspring from 144 broods, no size measurements for 8 broods); boxes are sorted by median offspring size; shown are median (middle line), 25th to 75th percentile (box), and 5th to 95th percentile (whiskers) as well as the raw data (points) for each individual. c The brood size vs. offspring size trade-off explains only very little of the variation; shown are individual means (points) ± SD (error bars) in brood/offspring size (N = 2522 offspring from 144 broods). The regression line (black) and 95% confidence interval (gray shadow) were estimated via linear mixed-effects model. d Differences in reproductive productivity can have profound long-term consequences because reproductive output accumulates over time; shown is the cumulative number of offspring produced by individuals over the first 280 days of life. a–d Coloration by onset (yellow represents late onset, purple represents early onset).

