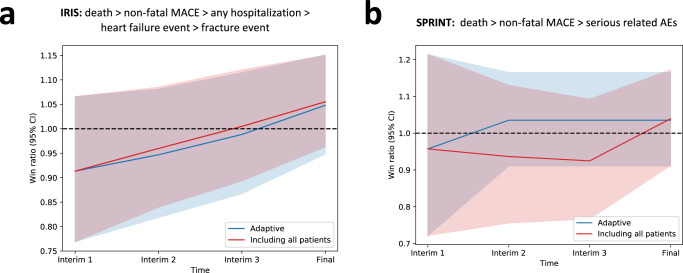
Fig. 5. Secondary outcome (safety) results.
Win ratio with corresponding 95% confidence intervals across the pre-defined interim analysis timepoints. (a) Results from IRIS for a hierarchical endpoint that includes all-cause mortality, followed by non-fatal MACE components, and then all-cause hospitalizations, heart failure events and bone fractures; (b) Results from SPRINT for a hierarchical endpoint that includes all-cause mortality, followed by non-fatal MACE components, and then serious adverse events. The lines correspond to the win ratio point estimate with shaded areas denoting the 95% confidence interval (for the adaptive trial design the point and upper and lower ends of the confidence interval were averaged across the ten simulations). Blue color denotes the adaptive runs, and red color denotes the original trial that includes all patients. IRIS Insulin Resistance Intervention after Stroke, MACE major adverse cardiovascular events, SPRINT Systolic Blood Pressure Intervention Trial.

