

Abstract
Differences in reproductive strategies can have important implications for macro- and micro-evolutionary processes. We used a comparative approach through a population genetics lens to evaluate how three distinct reproductive strategies shape patterns of divergence among as well as gene flow and genetic diversity within three closely related taxa in the genus Clarkia. One taxon is a predominantly autonomous self-fertilizer and the other two taxa are predominantly outcrossing but vary in the primary pollinator they attract. In genotyping populations using genotyping-by-sequencing and comparing loci shared across taxa, our results suggest that differences in reproductive strategies in part promote evolutionary divergence among these closely related taxa. Contrary to expectations, we found that the selfing taxon had the highest levels of heterozygosity but a low rate of polymorphism. The high levels of fixed heterozygosity for a subset of loci suggests this pattern is driven by the presence of structural rearrangements in chromosomes common in other Clarkia taxa. In evaluating patterns within taxa, we found a complex interplay between reproductive strategy and geographic distribution. Differences in the mobility of primary pollinators did not translate to a difference in rates of genetic diversity and gene flow within taxa – a pattern likely due to one taxon having a patchier distribution and a less temporally and spatially reliable pollinator. Taken together, this work advances our understanding of the factors that shape gene flow and the distribution of genetic diversity within and among closely related taxa.
Subject terms: Genetic variation, Plant ecology, Ecological genetics
Introduction
Plant reproductive strategies partially shape patterns of gene flow and genetic diversity within and among closely related plant taxa. The evolution of disparate reproductive strategies often aligns with broader diversification processes in that closely related taxa with different reproductive strategies frequently co-occur in distinct niches across a heterogenous landscape (Van der Niet and Johnson 2012; Anacker and Strauss 2014; Lancaster and Kay 2013; Grossenbacher et al. 2014). Ecological differences between microhabitats, such as distinct pollinator communities, can lead to divergent selection acting on reproductive strategies (Schemske and Bradshaw 1999; Campbell 2008), which may include (1) a shift to predominately autonomous self-pollination or (2) variation in floral traits that attracts distinct primary pollinators. Differences between reproductive strategies are likely to influence patterns of genetic exchange within taxa and may ultimately promote reproductive isolation and divergence between taxa (Hamrick and Godt 1996; Wright et al. 2013; Krauss et al. 2017; Gamba and Muchhala 2020; 2022; Wessinger 2020; Dellinger et al. 2022). Despite the range of characteristics that reproductive strategies can encompass, relatively few studies examine how reproductive strategies among more than two taxa influence population genetic parameters. As a result, developing a nuanced understanding of how reproductive strategies influence patterns of divergence, genetic diversity, and gene flow within and between closely related taxa would provide insight into the ecological drivers of speciation and the contemporary maintenance of genetic diversity.
Differences in reproductive strategies can accelerate divergence and isolation among closely related taxa. For example, the expansion of taxa into areas that have decreased pollinator or mate availability can create a selective advantage for self-fertilization (Stebbins 1970; Lloyd 1992; Moeller and Gerber 2005; Peterson and Kay 2015), which is often accompanied by a divestment in floral traits associated with pollinator visits (Levin 2010; Johnson et al. 2010) and an increase in autogamy (Goldblatt and Manning 2006; Cisternas-Fuentes et al. 2022). Over time, the restricted gene pool of a self-pollinating population can promote divergence even when there are overlapping ranges (Pettengill and Moeller 2012). Alternatively, if the colonization of a novel habitat is associated with a change in the pollination community, the floral phenotype may shift to increase pollinator efficiency of the new pollinator leading to reproductive isolation (Miller et al. 2014) and limiting hybridization between populations (Goldblatt and Manning 2006; Kay and Sargent 2009; Phillips et al. 2020). Disentangling how distinct reproductive strategies promote genetic divergence and reproductive isolation among closely related taxa will lend important insight into the processes that generate species-level diversity in heterogeneous landscapes.
Differences in reproductive strategies are also likely to impact patterns of pollen dispersal and therefore the distribution of genetic diversity within taxa. In autonomously selfing species, the effective population size and homozygosity are often reduced, which can severely dampen genetic diversity when compared with outcrossing taxa (Charlesworth et al. 2003; Shimizu et al. 2004; Sweigart and Willis 2003; Eschmann-Grupe et al. 2004). A decrease in the effective population size coupled with limited pollen movement will increase inbreeding and result in genetic drift becoming the dominant evolutionary mechanism, thereby increasing genetic differentiation between populations (Nordborg 2000; Pettengill et al. 2016). Although when selfing is associated with structural chromosomal changes (Rieseberg 2001; Lowry et al. 2008), a taxon may experience an increase in allelic diversity, and even fixed heterozygosity, especially in the case of allopolyploidization (Otto and Whitton 2000) or chromosomal translocations (Holsinger and Ellstrand 1984; Heiser and Shaw 2006). By contrast when there is a shift in primary pollinators, differences in the foraging behaviors of the pollen dispersers will determine patterns of gene flow (Castellanos et al. 2007; Diaz-Martin and Karubian 2021; Dellinger et al. 2022). Highly mobile pollinators can promote gene flow among populations, resulting in low genetic differentiation (Phillips et al. 2014; Krauss et al. 2017; Gamba and Muchhala 2020) and greater effective population size (Serbezov et al. 2012), which will reduce the effects of drift and isolation by distance (Kramer et al. 2011). Conversely, differences in how pollinators move between flowers and the degree of pollen carryover will determine rates of geitonogamy and biparental inbreeding within plant populations (Castellanos et al. 2007; Wessinger 2020; Steinecke et al. 2022). Resolving how shifts in reproductive strategies impact gene flow and genetic diversity among closely related taxa is an important step in understanding how ecological relationships inform evolutionary change over short and long time scales.
Here, we use a comparative approach to evaluate population genetic parameters within and between three closely related taxa that vary in their reproductive strategies in the genus Clarkia, section Eucharidium. Our three study taxa are C. concinna subsp. automixa, an autonomous selfing taxon, and two mixed mating taxa, C. concinna subsp. concinna, which is primarily pollinated by long-tongued flies and bees, and C. breweri, which is primarily pollinated by hawkmoths (Table 1). Numerous pollination studies in these taxa provide a rich foundation for exploring predictions focused at microevolutionary scales that can inform macroevolutionary processes (MacSwain et al. 1973; Groom 1998; Miller et al. 2014). Using single nucleotide polymorphisms (SNPs) generated from genotyping-by-sequencing (GBS) we first evaluate the extent of genetic divergence and the diversity of loci shared among the three taxa. Although previous work has shown that these taxa can hybridize in controlled conditions, we predict that these taxa will be genetically divergent in situ, with no evidence of hybridization, due to their geographic separation in the wild and differences in reproductive systems. We then filter data to identify the most variable loci within each taxon, to compare levels of inbreeding and genetic diversity within taxa and the gene flow and isolation by distance between populations for each taxon. We predict that in the predominantly selfing taxon, populations of C. concinna subsp. automixa, will have high levels of inbreeding, high genetic differentiation, and low levels of genetic diversity. As the hawkmoth pollinators of C. breweri are highly mobile, we expect this taxon to exhibit the highest amount of genetic diversity and the lowest levels of inbreeding and genetic differentiation and anticipate C. concinna subsp. concinna will have intermediate values of genetic diversity, inbreeding, and differentiation. By leveraging the three distinct reproductive strategies of closely related taxa, our work links ecological variation and associated changes in reproductive strategies to contemporary patterns of gene flow and genetic diversity as well as deeper evolutionary trends that influence plant diversification.
Table 1.
Population information and pollinator observation data for all three study species.
| Taxon | Population Name | Population Code (used in this or other studies) | # Samples included in this Study | Latitude | Longitude | Collector Number | Year(s) of Pollinator Observation Data Collection | Primary Pollinator Functional Group(s) Observeda | Secondary Pollinator Functional Group(s) Observedb | Source |
|---|---|---|---|---|---|---|---|---|---|---|
| C. concinna subsp. automixa | Mt. Hamilton | MH | 16 | 37.353118 | −121.63147 | LOL 898 | ||||
| Mt. Hamilton | MH | 0 | 1990 | Syrphid Fly | Raguso 1995 | |||||
| East of Mt Hamilton | CM2 | 13 | 37.349663 | −121.60812 | LOL 656 | |||||
| C. concinna subsp. concinna | Round Valley Road | RV | 11 | 39.82 | −122.65038 | LOL 383 | 2015 | Large bees* | Fig. S1; primarily diurnal observations | |
| Devilshead Road | DH | 13 | 38.82839 | −122.3443 | LOL 716 | 2015 | Long-tongued Flies, Bees | Fig. S1 | ||
| McLaughlin Natural Reserve | 0 | 38.497 8 N | 121.242 8 W | 2014, 2015 | Long-tongued Flies, Bees | Butterflies, hummingbird | Miller 2016 | |||
| Mark West Springs | MW | 15 | 38.54034 | −122.72084 | LOL 381 | 2015 | Hummingbirds* | Fig. S1; diurnal observations only | ||
| Lower Chiles Valley Road | LC | 13 | 38.53332 | −122.33165 | LOL 400 | 2015 | Long-tongued Flies* | Fig. S1 | ||
| Knoxville Road | KN | 0 | 1990, 2010 | Bees, Long-tongued Flies | Miller et al. 2014; natural populations | |||||
| C. breweri | Mt. Hamilton, Mile Marker 8 | MM | 14 | 37.35406 | −121.55803 | LOL 369 | 2015 | Hawkmoths* | Fig. S1; nocturnal observations only | |
| Mt. Hamilton, Mile Marker 8 | Arroyo Bayo | 0 | 37.340 8 N | 121.633 8 W | 1990, 1991, 1993, 1994 | Hawkmoths, Noctuid Moths | Large Bees, Hummingbirds | Miller et al. 2014 | ||
| East of Mt Hamilton | BM2 | 14 | 37.349663 | −121.60812 | LOL 657 | |||||
| Frank Raines | FR | 13 | 37.4222 | −121.3433 | LOL 008 | 2014 | Hawkmoths | Bees, Other Moths | Fig. S1 | |
| 2015 | Hawkmoths, Bees | Other Moths | Fig. S1 | |||||||
| 2016 | Hummingbird, Other Moths | Bees, Large Bees | Fig. S1 | |||||||
| Frank Raines, Del Puerto Canyon | 0 | 37.424 8 N | 121.369 8 W | 1990, 1991, 1993, 1994, 2010 | Hummingbirds | Bee, Long-tongued Flies, Hawkmoths | Miller et al. 2014; natural populations | |||
| Panoche Pass | PP | 14 | 36.64856 | −121.03833 | LOL 715 | 2015 | Hawkmoths* | Fig. S1 | ||
| 2015 | Hawkmoths | Bees | Fig. S1 | |||||||
| 0 | 1990 | Diurnal Hawkmoths | Raguso 1995; diurnal observations only | |||||||
| Pinnacles National Park | PI | 15 | 36.48296 | −121.16657 | LOL 296 | 2015 | Hawkmoths* | Fig. S1; nocturnal observations only | ||
| 2015 | Bees, Hawkmoths | Fig. S1 | ||||||||
| 2016 | Bees, Hawkmoths | Other Moths | Fig. S1 | |||||||
| Coalinga Road | CR | 14 | 36.01547 | −120.47276 | LOL 283 | 2015 | Hawkmoths* | Fig. S1 |
Pollinator observation data are provided in Figure S1 or summarized from Miller et al. 2014. Adjacent rows with the same shading are from populations that are within 15 km of one another.
a70–100% of all visits.
b10–29% of all visits.
*98–100% of visits were made by the pollinator functional group(s).
Methods
Study system
The genus Clarkia comprises ~40 taxa native to the western United States and one species in South America. We focused on three of the four taxa in section Eucharidium. Clarkia concinna subsp. concinna is a common taxon that is widely distributed from northern California to the central coast and is found in the understory of mesic mixed evergreen forests and oak/pine woodlands (Fig. 1; Goff et al. 2021). Clarkia concinna subsp. automixa occurs in similar habitats in a relatively small area at the southern edge of the range of C. concinna subsp. concinna (Fig. 1; Allen et al. 1990; Kay et al. 2019). Clarkia breweri is found in xeric, rocky woodlands and chaparral in the inner coast range mountains of central California (Fig. 1; Goff et al. 2021). The range of C. breweri is smaller than that of C. concinna subsp. concinna and this taxon is relatively uncommon (Goff et al. 2021) but is also parapatric with C. concinna subsp. automixa, with some populations separated by less than tens of meters. All three taxa are self-compatible annuals and C. concinna subsp. concinna and C. breweri are known diploids (Gottlieb and Weeden 1979; Pichersky and Gottlieb 1983).
Fig. 1. Distribution, sampling, and reproductive strategy for the three study taxon of Clarkia collected from twelve populations across California.

Shown is A a map of study area for collections across California, B C. concinna subsp. automixa (blue), C C. concinna subsp. concinna (green), and D C. breweri (yellow). Sampled populations are denoted as diamonds and occurrence data for populations of each taxon are circles. Below each taxon is an icon(s) representing the reproductive strategy. Bee and hawkmoth icons by T. Jogesh and the long-tongued fly icon was obtained from www.divulgare.net.
The three study taxa differ in floral traits and pollinator visitation and efficiency. Flowers of C. concinna subsp. automixa are smaller than those of C. concinna subsp. conncina and the stigma becomes receptive before the bud opens, resulting in self-fertilization in the bud (Bowman 1987; Kay et al. 2019), although infrequent visits by hoverflies and bees have been observed (R.A. Raguso and K.M. Kay, personal observations). Compared to C. concinna, the flowers of C. breweri are paler in color and have longer stigmas, anthers and hypanthia, and wider hypanthium openings, produce more nectar with a higher mean sucrose to hexose ratio, and have a larger distance between the nectar reward and anthers (Miller et al. 2014; Kay et al. 2019). Clarkia breweri is the only species in the genus with flowers that open in the evening and produce a strong, sweet fragrance (MacSwain et al. 1973; Raguso and Pichersky 1995), and is visited most commonly by nocturnal moths (primarily hawkmoths, such as Hyles lineata and Sphinx perelegans) and hummingbirds, and to a lesser extent by less-mobile pollinators (bees, long-tongued-flies, butterflies and noctuid moths; MacSwain et al. 1973; Miller et al. 2014; Kay et al. 2019; Table 1; Fig. S1). Hawkmoths were found to be the most effective pollinators of C. breweri (Miller et al. 2014). Clarkia concinna subsp. concinna is visited most often by diurnal bees and long-tongued bombyliid flies and to a lesser extent small bees and butterflies (MacSwain et al. 1973; Groom 1998; Miller et al. 2014; Kay et al. 2019; Table 1; Figure S1). Diurnal pollinators (long-tongued flies, bees, and diurnal lepidopterans) have been shown to be more effective visitors to C. concinna subsp. concinna. Using the floral traits and pollinator efficiency information (described above and in Table 1) for each taxon, we categorized C. concinna subsp. concinna as pollinated by long-tongued flies and bees; C. concinna subsp. automixa as autogamous; and C. breweri as pollinated by hawkmoths.
Field methods
Genetic sample collection
To evaluate how reproductive strategies influence the patterns of divergence and genetic diversity, we sampled leaf tissue from 14–16 individuals per population from four populations of C. concinna subsp. concinna (n = 60 total), two populations from C. concinna subsp. automixa (n = 31 total), and six populations of C. breweri (n = 91 total) for a total of 12 sampled populations (n = 182 individuals; Fig. 1; Table 1). Although we did not sample the complete range of C. concinna subsp. concinna, the extent of the sampling for this taxon was equivalent to that of C. breweri. Specifically, the maximum distance between sampled populations of C. concinna subsp. concinna is ~ 150 km, the sampling area is ~27,800 ha, and the maximum distance between all known populations is ~425 km. The maximum distance between sampled populations of C. breweri is ~170 km and the sampling area is ~29,700 ha. Because we controlled geographic area in this sampling approach, we can directly compare measures of genetic diversity and gene flow between the two outcrossing taxa without introducing a confounding variable of distance. Two of our study populations (C. breweri – BM2 and C. concinna subsp. automixa – CM2) were within meters of each other on opposing slopes of a ravine, with C. breweri on north-facing slopes and C. concinna subsp. automixa on south-facing slopes (Mt. Hamilton, Santa Clara Co., CA), but we suspected little to no gene flow between individuals as the flowers of C. concinna subsp. automixa self-pollinate in bud before the flowers open. Leaf tissue was collected in individually labeled coin envelopes, dried with silica gel, and stored at −20 °C until DNA extraction.
Genetic analyses
Ploidy analysis
We determined the ploidy of Clarkia concinna subsp. automixa using a control sample of Clarkia concinna subsp. concinna (known diploid) collected from a wild population of Chiles Pope Valley Road in Napa County. A test sample of C. c. subsp. automixa was collected from Blue Oak Ranch Reserve in Santa Clara County. Ploidy analysis was performed by Lifeasible (Shirley, NY) using a BD FACS Calibur flow cytometer, 20-mW laser illumination at 488 NM, FL-2 585/40-nm bandpass filter.
DNA extraction and sequencing
We extracted genomic DNA following a modified cetyltrimethylammonium (CTAB) developed by Doyle and Doyle (1987). We used single nucleotide polymorphisms (SNPs) generated from genotyping-by-sequencing libraries which were prepared following Elshire et al. (2011) and using the restriction enzyme ApeKI to fragment the genome. To avoid any batch effect, half the individuals from each population were split between the two genomic libraries of 96. Each polymerase chain reaction (PCR) was carried out independently for all samples, and each library was then quantified using High sensitivity QubitTM (dsDNA HS Assay Kit, Thermo Fisher Scientific) and then pooled in the final step before sequencing to assure an equivalent amount of each sample was present in the final genomic library. Sequencing was performed using Illumina HiSeq, 150 bp Paired-End reads at the Center for Genetic Medicine at Northwestern Medicine.
Calling single nucleotide polymorphisms (SNPs)
We used STACKS v 2.2 (Catchen et al. 2011, 2013) to call single nucleotide polymorphisms (SNPs) to generate four distinct datasets. We generated a combined set to compare measures of genetic diversity and divergence among taxa, and one dataset per taxon for comparisons between populations within taxa. To evaluate divergence among C. concinna subsp. automixa, C. concinna subsp. concinna, and C. breweri, we called SNPs that were shared among at least two taxa (i.e., the combined dataset). Because the combined dataset resulted in many loci being monomorphic within one taxon but polymorphic in the others, it was necessary to call SNPs for each taxon separately to assess genetic diversity, inbreeding, and population structure within taxa. For the combined and separate datasets, the parameters -m, -M, -n, -max-locus-stacks, and -bound-high were optimized using four samples from each population run across lanes and changing one parameter at a time. The ‘best’ parameters were those that maximize the number of SNPs while minimizing genetic distance between samples from the same populations as generated in a metric multi-dimensional scaling (MDS) plot using PLINK 2 (Purcell et al. 2007; Mastretta-Yanes et al. 2015) – the parameters used to call SNPs varied for each dataset (Appendix A, Fig. S2–5, Table S1a, b).
For the combined dataset, we built a catalog using all samples and labeled them by taxonomic assignment (C. concinna subsp. automixa, C. concinna subsp. concinna, and C. breweri) for the population map. We ran the ‘populations’ command in STACKS and only called loci that were present in at least two of the three taxa (-p 2), in at least 50% of individuals in a taxon (r −0.5), and with a minor allele frequency greater than 0.05 (-maf 0.05), and one SNP per sequence. For the three datasets where SNPs were called separately for C. concinna subsp. automixa, C. concinna subsp. concinna, and C. breweri, we built catalogs with five samples from each population and included samples that had high numbers of reads and were collected across the population and sequenced on different plates. For the ‘populations’ command, we specified that loci needed to be in at least 80% of individuals (-r 0.80), the minor allele frequency needed to be greater than 0.05 (as suggested by Paris et al. 2017), and one SNP per sequence was allowed. All datasets were then quality filtered for read depth, missing data, and Hardy-Weinberg Equilibrium (Appendix A). In total 16 individuals failed to pass quality filtering leaving a total sample size of 166 individuals, with 52 individuals of C. concinna subsp. concinna, 29 individuals of C. concinna subsp. automixa and 84 individuals of C. breweri.
Statistical analyses
Among taxa – genetic divergence and diversity
We used the combined dataset to determine the amount of divergence among taxa with distinct mating systems. We used the program ADMIXTURE 1.3.0 (Alexander et al. 2009) to evaluate population genetic structure among taxa by considering genetic clusters, or K, from 1–10 and employing a cross-validation procedure. We considered the most appropriate number of K to be the one with the lowest cross-validation score or the K at the ‘knee’ of the cross-validation plot. We then used ADMIXTURE to calculate pairwise FST between the genetic clusters. In addition, we evaluated the divergence among groups by using the first two axes of a scaled and centered principal components analysis (PCA) generated with the program adegenet() (Jombart 2008). All analyses were conducted in R v. 4.0.2 (R Core Team 2020), unless noted otherwise.
We also used the combined dataset to evaluate patterns of genetic diversity of the loci shared between taxa. Using the STACKS populations output, we calculated the number and percent of polymorphic loci. The low population sample size precluded the use and testing of population-based measures of genetic diversity and inbreeding. However, robust sampling at the individual level enabled the use of the genhet() function in R to measure the individual level proportion of heterozygous loci (PHt), or the number of heterozygous loci over number of genotyped loci (Coulon 2010). We then used the stats() package (R Core Team 2020) to test for taxon-based differences in PHt using a pairwise Wilcoxon rank sum test with a Bonferroni correction.
Within taxa – genetic diversity, inbreeding, effective population size, and gene flow
Using the three datasets called for each taxon separately, we investigated inbreeding, genetic diversity, gene flow, and effective population size (NE). We again measured individual level PHt and as well as the inbreeding coefficient (F) using PLINK 2 and the –het command (Purcell et al. 2007). We tested for taxon-based differences in PHt and F using a pairwise Wilcoxon rank sum test with a Bonferroni correction. We then estimated NE of each population using the program NeEstimator v. 2.1. (Do et al. 2014). The linkage disequilibrium method, which calculates NE based on the amount of linkage disequilibrium within a population while correcting for sample size, was unable to estimate measures of NE and 95% confidence intervals (Waples and Do 2010). However, the heterozygote excess method estimated NEB, or the effective number of breeders, which gives reliable insight into NE when the effective population size is small (Zhdanova and Pudovkin 2008; Waples and Do 2010; Gilbert and Whitlock 2015). This method takes advantage of random differences in allele frequencies between parents in a small population, which results in an excess of heterozygote genotypes compared to expectations under Hardy-Weinberg Equilibrium (Pudovkin et al. 1996). We tested for differences in NEB between C. concinna subsp. concinna and C. breweri using a Kruskal-Wallis rank sum test with the stats() package but were unable to include C. concinna subsp. automixa in this assessment due to low sample size.
We again used ADMIXTURE and PCA plots as described above to compare population genetic structure and gene flow between populations within taxa. In addition, we used the program GENEPOP to calculate pairwise FST (Weir & Cockerham 1984) between populations for each taxon. We then used an independent two group Mann-Whitney U Test to test for differences in pairwise FST between C. concinna subsp. concinna and C. breweri. We were unable to include C. concinna subsp. automixa because only two populations were sampled. We also evaluated patterns of isolation by distance for C. concinna subsp. concinna and C. breweri, the two taxa with sufficient sampling. We calculated a pairwise matrix with FST / (1 – FST) (Rousset 1997) between populations as well as a pairwise matrix with the log of geographic distance between populations. We then used both in a Mantel test in the R package ade4 with 9999 replicates (Dray and Dufour 2007).
Results
We generated four distinct datasets: a combined dataset with single nucleotide polymorphisms (SNPs) shared among taxa and three datasets with SNPs called for each taxon separately. The number of SNPs included in the analyses for each dataset were 1338 for the combined dataset, 426 for C. concinna subsp. automixa, 292 for C. concinna subsp. concinna, and 370 for C. breweri. All four datasets had moderate to high average missing data (range = 14.23–34.56) and depth of coverage (range = 18.56 – 26.39) for individuals (Table S2). Similarly, the four datasets had moderate to high average missing data (range = 14.23–32.82) and depth of coverage (range = 19.50–34.56) for loci (Table S2). Missing data and read depth coverage varied across populations (Table S3).
Ploidy analysis
Clarkia concinna subsp. concinna and C. concinna subsp. automixa are the same ploidy, meaning C. concinna subsp. automixa is diploid (Figure S6).
Among taxa – Genetic divergence and diversity
From the combined dataset, 1338 loci were found in at least two taxa, of which 1190 (88%) were shared by all three taxa (Table 2). Of the remaining 148 loci, 100 were not found in C. concinna subsp. automixa, while 40 were absent in C. concinna subsp. concinna, but none were absent from C. breweri, which was not surprising given that this taxon included the most individuals in the SNP calling pipeline (Table 2). When evaluating population structure of all taxa together, we found K = 3 to be near the ‘knee’ of the cross-validation plot and most biologically meaningful, representing the optimal number of genetic clusters (Figure S7a). Each taxon was represented by a distinct genetic cluster with little admixture (Fig. 2A), which was also supported by the first two components of the principal components analysis (Fig. 2B). We observed high genetic divergence among taxa, with the highest FST value between C. breweri and C. concinna subsp. automixa (0.34). FST values between the two subspecies C. concinna subsp. automixa and C. concinna subsp. concinna (0.27) were higher than those between species, C. concinna subsp. concinna and C. breweri (0.20).
Table 2.
Summary of genetic diversity and inbreeding measured for three taxa, Clarkia concinna subsp. automixa, Clarkia concinna subsp. concinna, and Clarkia breweri, distributed across California.
| Taxon | # Inds. | # Loci | Percent of loci shared witha | # Polymorphic Locia | % Polymorphic Locia | HEa | PHtb | Fb | |||
|---|---|---|---|---|---|---|---|---|---|---|---|
| Both other taxa | C. concinna subsp. automixa | C. concinna subsp. concinna | C. breweri | ||||||||
| C. concinna subsp. automixa | 21.7 | 1,228 | 97% | – | 0% | 3% | 611 | 50% | 0.08 | 0.29 ± 0.22 | −0.25 ± 0.93 |
| C. concinna subsp. concinna | 38.4 | 1,300 | 92% | 0% | – | 8% | 953 | 73% | 0.24 | 0.20 ± 0.03 | 0.04 ± 0.17 |
| C. breweri | 59.1 | 1,338 | 89% | 3% | 8% | – | 914 | 68% | 0.17 | 0.19 ± 0.07 | 0.04 ± 0.34 |
Shown are the mean number of individuals genotyped (# inds.) and the total number of loci genotyped (# loci) per taxon; the percent of variable loci shared with both other taxa and exclusively with each taxon; the number of polymorphic loci; the percent of polymorphic loci and expected heterozygosity (HE). Also shown are the individual level measures of the average proportion of heterozygous loci (PHt) and average inbreeding (F). ± 1 standard deviation.
aMetric generated using the combined dataset (i.e., loci shared among taxa).
bMetric generated using dataset specific to each taxon (i.e., loci called within taxon).
Fig. 2. Genetic divergence and diversity among C. concinna subsp. automixa (blue), Clarkia concinna subsp. concinna (green), and C. breweri (yellow) collected from twelve populations across northern California.

A Individual ancestry assignment for each bar (individual) by the percent of assigned ancestry to each genetic cluster by ADMIXTURE. X-axis labels provide population names. B The first two axes of a principal components analysis where each point is an individual whose color represents the assigned genetic cluster from ADMIXTURE. The percent variation explained by each axis is denoted in parentheses. C Boxplots of the proportion of heterozygous loci (PHt) for loci shared by at least two taxa with means represented by X. **p < 0.01 ***p < 0.001.
The combined dataset also showed that C. concinna subsp. concinna had the highest proportion of polymorphic loci (73%), followed by C. breweri (68%), with C. concinna subsp. automixa having the fewest polymorphic loci (50%) (Table 2). This pattern was reflected in measures of expected heterozygosity, with C. concinna subsp. automixa, having the lowest expected heterozygosity (HE = 0.08) compared with the other two taxa with mixed mating systems, which had two to three-fold greater measures (HE = 0.17 and HE = 0.24 for C. breweri and C. concinna subsp. concinna, respectively) (Table 2). In contrast, when evaluating the proportion heterozygous loci (PHt) within an individual, we observed the opposite pattern, with heterozygosity in C. concinna subsp. automixa being significantly higher (average = 0.18 ± 0.05) than the other two taxa (p < 0.0001) (Fig. 2C). This was despite 50% of loci in C. concinna subsp. automixa being monomorphic (i.e., fixed for homozygosity), which was considerably higher than the 32% of fixed loci in C. breweri and 27% of fixed loci in C. concinna subsp. concinna. On closer inspection, the elevated PHt in C. concinna subsp. automixa was found to be driven by several loci showing fixed heterozygosity in all individuals. We generated a histogram of heterozygosity values for all loci and found a bimodal distribution of heterozygosity in C. concinna subsp. automixa, which was not observed in either of the other taxa (Figure S8). The first peak at 0 suggests that 50% of variable loci in C. concinna subsp. automixa are fixed for homozygosity, while the second peak at 1 suggests that all individuals are fixed heterozygous for 11% of loci, which represents 23% of the variable loci (Figure S8). By comparison, both C. concinna subsp. concinna and C. breweri did not have any loci that showed fixed heterozygosity (Figure S8). We also found that PHt was significantly higher in C. concinna subsp. concinna (average = 0.14 ± 0.04) than in C. breweri (average = 0.12 ± 0.04; p = 0.0038) (Fig. 2c).
Within taxa – Genetic diversity, inbreeding, effective population size, and differentiation
Using the datasets for SNPs called for each taxon separately, our results for within taxa measures of genetic diversity and inbreeding did not match our predictions. We found that within taxa measures of the proportion of heterozygous loci in individuals (PHt) and inbreeding (F) was consistent among taxa (Fig. 3A, B; Table 2) and were not significantly different (p = 1 for all pairs; Figure S9; Table S3). However, we observed substantial variation in PHt and F among populations of C. concinna subsp. automixa and to a lesser extent in C. breweri (Fig. 3A,B). The effective population size (NEB) was significantly higher in C. concinna subsp. concinna (average = 13.25 ± 9.99) than in C. breweri (average = 4.28 ± 2.42) (Fig. 3c; Table S3) and was lowest for C. concinna subsp. automixa (average = 3.65 ± 0.63).
Fig. 3. Within taxa measures of genetic diversity, inbreeding, and effective population size for Clarkia concinna subsp. automixa, Clarkia concinna subsp. concinna, and Clarkia breweri collected from twelve populations across northern California.
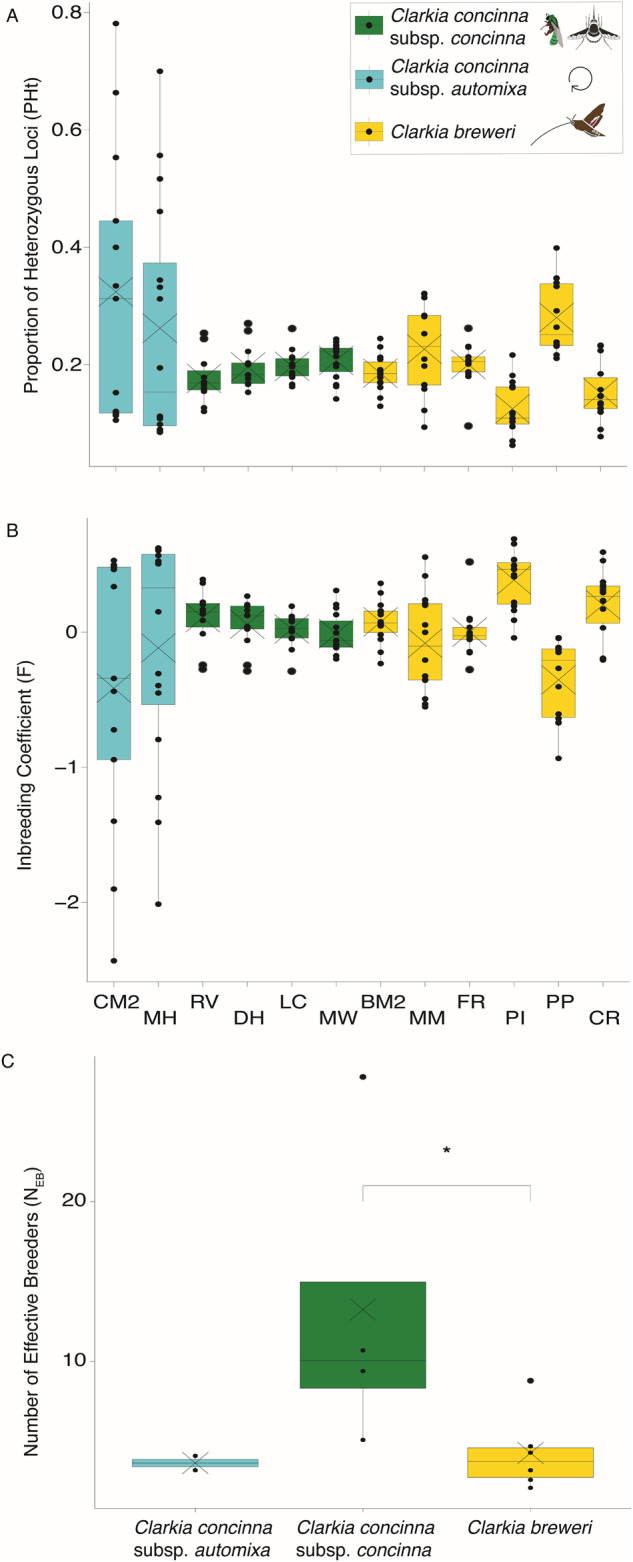
Box plots of A genetic diversity (PHt), B inbreeding (F), and C the number of effective breeders (NEB) for C. concinna subsp. automixa (blue), C. concinna subsp. concinna (green), and C. breweri (yellow) collected from twelve populations across northern and central California. The average is shown with X. Measures were calculated using SNPs called for each taxon separately. C. concinna subsp. automixa was not included in tests for NEB due to low sample size. *p < 0.05.
Patterns of population genetic structure and differentiation within each species also differed from expectations. We found the cross-validation score to be lowest for K = 3 for C. concinna subsp. automixa, K = 2 for C. concinna subsp. concinna, and K = 4 for C. breweri (Figure S7b-d). Despite their proximity ( < 3 km), each population of C. concinna subsp. automixa formed a distinct genetic cluster moderately diverged from the other (pairwise FST = 0.15) with a third cluster spanning both populations that was highly diverged from each population (Fig. 4b; Table S4a). Upon further investigation, we found that the individuals with ancestry assignment to this third genetic cluster were those that exhibited high rate of PHt and low inbreeding (Table S5). Genetic structure was distributed geographically for C. concinna subsp. concinna, splitting the populations along the California coastal mountain range into eastern and western clusters (Fig. 4a; Table S4b). Genetic differentiation varied from low to high among populations of C. concinna subsp. concinna (range = 0.07–0.25) with an average population pairwise FST of 0.17 ( ± 0.08; Table S6a). The population pairs with the largest FST values always included the comparison between eastern and western populations. Similarly, C. breweri populations showed a geographic pattern with populations split into northern, eastern, western, and southern genetic clusters (Fig. 4c; Table S4c). Population pairwise FST for C. breweri varied from low to high (range = 0.04–0.25) with an average of 0.17 ( ± 0.07; Table S6b). Given the large spread in values, there was no significant difference in average pairwise FST between C. concinna subsp. concinna and C. breweri (W = 42, p > 0.05). We found a significant effect of isolation by distance for C. breweri (observation = 0.66, p = 0.006), but not for C. concinna subsp. concinna (observation = −0.14, p = 0.29).
Fig. 4. Within taxa measures of population genetic structure for Clarkia concinna subsp. automixa, Clarkia concinna subsp. concinna, and Clarkia breweri collected from twelve populations across northern California.

Shown is the genetic differentiation between populations (left) and the first two axes of principal components analyses (right) of A C. concinna subsp. automixa (2 populations), C C. concinna subsp. concinna (4 populations), and E C. breweri (6 populations) collected across northern California. For the genetic differentiation bar charts, bars are individual ancestry assignment by the percent of assigned ancestry to each genetic cluster by ADMIXTURE. X-axis labels indicate population names. B, D, F First two axes of the PCAs where each point is an individual and colors represent assigned genetic cluster from ADMIXTURE. The percent variation explained by each axis is denoted in parentheses.
Discussion
By evaluating realized mating events in three well-studied and closely related taxa, we gained insight into the roles that reproductive strategies play in shaping patterns of divergence, genetic diversity, and gene flow among and within taxa. We found support for our prediction that our three study taxa with different reproductive strategies would be genetically distinct and suggest that differences in pollinator availability and effectiveness in part limit genetic exchange within this group. In line with our predictions, we found that populations of Clarkia concinna subsp. automixa had the lowest percentage of polymorphic loci and genetic diversity (HE) and fewer shared polymorphic loci compared to the two outcrossing taxa. Surprisingly, we also observed that C. concinna subsp. automixa had a large portion of loci fixed for heterozygosity and that measures of inbreeding and the proportion of heterozygous loci were highly variable in this taxon. Together, these patterns observed in C. concinna subsp. automixa suggest structural rearrangements to chromosomes in this taxon. Contrary to our predictions, we did not detect significant differences in levels of genetic diversity, inbreeding, or gene flow between the two outcrossing taxa, which may be attributed to differences in the distribution and abundance of populations of these taxa. While our limited sampling and replication at the level of mating system prevents broad generalizations, we show that in addition to reproductive strategy, variation in other biotic and abiotic factors influence patterns of divergence, gene flow, and genetic diversity within and among taxa. Taken together, this work provides insight into the ecological processes shaping patterns of genetic diversity and gene flow in closely related taxa.
Among taxa – Genetic divergence and diversity
Our results support the idea that divergence among C. concinna subsp. automixa, C. concinna subsp. concinna, and C. breweri is in part facilitated by differences in reproductive systems that limit genetic exchange between them. Autogamy likely promoted the evolution of C. concinna subsp. automixa from C. concinna subsp. concinna and may have been driven and reinforced by differences in chromosomal structures (see below) (see Wright et al. 2013; Hu 2015). In addition, a transition to a predominantly self-fertilizing mating system commonly ensures reproduction when pollinators are scarce (Stebbins 1970; Lloyd 1992; Moeller and Geber 2005). It is believed that C. breweri is derived from a C. concinna-like ancestor (Lewis and Lewis 1955; Sytsma et al. 1990) and our data show that pairwise FST was lowest between these two outcrossing species, suggesting there remains some genetic overlap between them, which can either be the result of historic introgression or incomplete divergence due to recent isolation (Nelson et al. 2021). Indeed, both C. concinna subsp. concinna and C. breweri have the same number of chromosomes and can produce viable advanced generation hybrids in controlled lab settings (Raguso and Pichersky 1995; 1999). However, we documented very little genetic exchange between all three taxa, likely due to their parapatric ranges, distinct habitats, and floral isolation. For example, the range of C. concinna subsp. concinna is limited to regions with relatively high water availability (Goff et al. 2021), while that of C. breweri is thought to be limited by biotic factors, as it inhabits bare, rocky, xeric and open habitats with low competition (Goff et al. 2021). Together, the interplay between different mating systems with various biotic (e.g., pollination communities, competitive environments) and abiotic (e.g., habitat and climate characteristics) factors likely serves to increase isolation between taxa and, if maintained, should continue to increase genetic divergence over time.
The behavior of primary pollinators is likely to impact divergence between outcrossing taxa. Although flower-naïve hawkmoths (i.e., those that have never been exposed to any Clarkia flowers) will visit all three Clarkia taxa when they are presented together in experimental conditions, wild hawkmoths have never been observed visiting C. concinna in natural populations, despite their presence throughout the species’ range (Miller et al. 2014; Kay et al. 2019). The lack of hawkmoth visitation is likely because C. concinna do not produce the powerful, linalool- and aromatic ester-dominated floral scent found in C. breweri, which likely attracts moths from a distance (Raguso and Pichersky 1995; Raguso and Willis 2005). In addition, diurnal bees and flies that serve as the primary pollinators of C. concinna subsp. concinna are less common in environments where C. breweri is distributed (Miller et al. 2014). In experimental conditions, bees and flies are relatively ineffective pollinators for C. breweri and hawkmoths are similarly ineffective pollinators for C. concinna subsp. concinna and C. concinna subsp. automixa (Miller et al. 2014; Kay et al. 2019). Our data and observations suggest that gene flow between these closely related Clarkia species is likely limited by differences in pollinator preferences and distinct floral morphologies.
Our finding that C. concinna subsp. concinna exhibits the highest rates of polymorphic loci shared among taxa can be explained, in part, by differences in the geographic distribution of each taxon. Species that are more abundant and occur across larger geographic areas often have higher effective population sizes and higher genetic diversity than those that occur more sparsely across a smaller area (Hamrick and Godt 1996; Hoban et al. 2021). Here, the range of C. concinna subsp. concinna is larger than those of the other two taxa, its populations are more abundant (Goff et al. 2021), and it has a larger effective population size, all of which likely contribute to genetic diversity that results in the highest amount of polymorphism across loci. On the other hand, in addition to having an especially small range and occurring in a few populations, the predominantly selfing mating system of C. concinna subsp. automixa has an effective population size half that of C. concinna subsp. concinna, leading to lower genetic diversity (i.e., the lowest amount of polymorphism of the three taxa) as predicted by theoretical studies (Charlesworth 2009; Nordborg 2000). Indeed, a reduction in effective population size by a factor of two is common in selfing species compared with outcrossing species (Nordborg 1997). C. breweri is intermediate in both the extent of its distribution, degree of population abundance (Goff et al. 2021), effective population size, and values for observed rates of polymorphism among shared loci. Incorporating taxon distribution and abundance into our understanding of genetic diversity among taxa provides a more comprehensive view of the processes impacting population genetic parameters.
Interestingly we found that the predominantly selfing taxon, C. concinna subsp. automixa, had the highest proportion of heterozygous loci within an individual (PHt) for the shared loci, which was unexpected for an autogamous species. The observed patterns of fixed heterozygosity in this taxon might suggest an allopolyploid origin, but as flow cytometry confirmed that the taxon is diploid, we suspect the presence of chromosomal rearrangements or aneuploidy. Although we are unaware of any cytological studies in C. concinna subsp. automixa, there has been extensive cytological research in this genus and family. Numerous studies have documented widespread chromosomal rearrangements and aneuploidy in Onagraceae (Johansen 1929; Bloom 1974, Raven 1979). Reciprocal translocations are common (Golczyk et al. 2014) and have been documented in several Clarkia species (Lewis 1953a, 1953b; Wedberg et al. 1968; Gottlieb and Weeden 1979). These translocations result in the formation of rings during meiosis made of two or more chromosomes (Holsinger and Ellstrand 1984). Given the prevalence of translocations within the genus (Raven 1979), we suspect that the fixed heterozygosity observed in C. concinna subsp. automixa is the result of chromosome rings being formed during meiosis preventing recombination and Mendelian segregation in some loci. If true, it would be the first record of chromosomal rearrangement in Clarkia section Eucharidium (Lewis 1953a, 1953b; Wedberg et al. 1968; Gottlieb and Weeden 1979). However, these results should be interpreted with caution given that only two populations were sampled from a limited part of the geographic distribution. While severe inbreeding depression and heterozygote advantage could theoretically explain these patterns, it would necessitate both alleles at a locus be lethal in order for fixed heterozygosity to be expressed in a population and would result in a continuous, rather than bimodal, distribution of heterozygosity. Future studies of C. concinna subsp. automixa should involve a more complete population sampling, meiotic chromosome squashes, and long read genome resequencing to document the presence and prevalence of chromosome rings.
Within taxa – Genetic diversity, inbreeding, effective population size, and differentiation
We found that the interplay between pollinator behavior and plant abundance and distribution is an important facet impacting realized mating events within taxa. Compared to C. c. subsp. concinna, populations of C. breweri are less abundant, more isolated, and are distributed across a smaller and less contiguous range (Goff et al. 2021). However, as hawkmoths have been shown to facilitate extensive gene flow in other species in Onagraceae (Skogen et al. 2019), we expected to find higher within-taxa levels of genetic diversity and lower levels of inbreeding and genetic structure in C. breweri compared to C. c. concinna – patterns we did not detect in this study. Hawkmoths are unreliable pollinators across both space and time, which likely increases pollination by less effective floral visitors when moths are scarce and may also explain the variability in measures of genetic diversity and inbreeding between populations of C. breweri (Willmott and Burquez 1996; Aldridge and Campbell 2007; Artz et al. 2010; Table 1). In addition, we observed isolation by distance in C. breweri suggesting that the low abundance of populations of this taxon coupled with the variation in hawkmoth visitation decreases connectivity between populations and increases drift in this system. In contrast, Clarkia concinna subsp. concinna had little variation in inbreeding and genetic diversity across populations. The lack of isolation by distance and the high variation in FST between populations of C. concinna subsp. concinna suggests that pollen dispersal follows a leptokurtic probability distribution meaning that while most dispersal occurs between neighboring plants, infrequent long-distance dispersal occurs between populations (Nathan et al. 2012; Diaz-Martin et al. 2023). Taken together our results suggest that in C. concinna subsp. concinna, larger bees and long-tongued flies may be able to maintain genetic connectivity across part of this taxon’s range (Kramer et al. 2011; Gamba and Muchhala 2022). In addition, although bees and long-tongued flies are the most common pollinators of C. concinna subsp. concinna, it is also visited by a wide array of other pollinators such as diurnal moths, butterflies, and hummingbirds (Miller et al. 2014), raising the possibility that the high density of conspecific populations and the wide variety of pollinators maintain gene flow in this species. We recommend future work investigate the connection between the number and proximity of populations, variability in inbreeding and genetic diversity and structure, and pollinator visitation to fully understand the causes and consequences of reproductive strategies across the landscape.
In line with our expectations, we found strong population genetic structure among populations of C. concinna subsp. automixa. Limited pollen flow due to selfing likely exacerbated the effects of limited seed dispersal between populations and resulted in high genetic structuring between the two populations of C. concinna subsp. automixa, despite their close geographic proximity (~2 km). Indeed, outcrossing versus selfing has been shown to be a good predictor of genetic structure, with selfers having higher structure than outcrossing species (Hamrick and Godt 1996; Pettengill et al. 2016). Our work suggests that the lack of genetic exchange between populations due to the self-fertilizing system increases genetic differentiation within this taxon.
Our work demonstrates how reproductive strategies in three closely related taxa promote divergence among taxa, and shape patterns of genetic diversity, inbreeding, and gene flow within taxa. Along with specialization to areas with distinct abiotic, competitive, and pollinator environments, differences in reproductive strategies restrict gene flow to promote divergence among C. concinna subsp. concinna, C. concinna subsp. automixa, and C. breweri. We also find the first evidence suggesting chromosomal rearrangements fix heterozygosity in the self-fertilizing C. concinna subsp. automixa, but future studies are needed to evaluate the presence and any potential adaptive advantage of these putative structural mutations. In addition, we detected a complex interplay between pollinator mobility, a taxon’s distribution and abundance, and the subsequent patterns of gene flow and genetic diversity. Notably, the reliability of the most effective primary pollinator(s) and the density of populations may be more important than pollination syndrome alone in predicting patterns of genetic diversity. An important next step would be to increase replication at both the level of populations within taxa as well as reproductive strategies among taxa to better understand the drivers of genetic diversity and gene flow. Taken together, our work underscores how variation in reproductive strategies may be associated with a variety of ecological factors that interact to impact past diversification events as well as the current processes shaping patterns of genetic diversity and gene flow.
Supplementary information
Acknowledgements
We thank Matt Rhodes, Shelley Sianta, Tim Miller, Rick Overson, Tania Jogesh, Evan Hilpman, and Pedro Juárez for assistance with data collection and Rick Overson for assistance with genomic library preparation. We are also grateful to Elinor Gates, Kostas Chloros, and Joseph Halay for facilitating plant collections on the grounds of the UC Lick Observatory. Permission was granted by the National Park Service to collect data and samples at Pinnacles National Park. This work was supported by US National Science Foundation DEB 1342873 to JF and KS and DBI 1461007 to JF. Samples were collected under permits FS-2400-8 and PIN-2014-SCI-003.
Author contributions
ZDM, ACF, KS, KK, RR, JF conceived and designed the study. ACF, KS, KK, and JF collected the data and determined the methodology. Investigation and visualization were conducted by ZDM. Funding was acquired by KS and JF. Writing of the original draft was completed by ZDM and JF. Writing, review, and editing of the further drafts were completed by ZDM, ACF, KS, KK, RR, and JF.
Data availability
Relevant data and code have been uploaded to a Dryad repository: 10.5061/dryad.sxksn038b.
Competing interests
The authors declare no competing interests.
Footnotes
Associate editor: Marc Stift.
Publisher’s note Springer Nature remains neutral with regard to jurisdictional claims in published maps and institutional affiliations.
Supplementary information
The online version contains supplementary material available at 10.1038/s41437-023-00649-y.
References
- Aldridge G, Campbell DR. Variation in pollinator preference between two Ipomopsis contact sites that differ in hybridization rate. Evolution. 2007;61:99–110. doi: 10.1111/j.1558-5646.2007.00008.x. [DOI] [PubMed] [Google Scholar]
- Alexander DH, Novembre J, Lange K. Fast model- based estimation of ancestry in unrelated individuals. Genome Res. 2009;19:1655–1664. doi: 10.1101/gr.094052.109. [DOI] [PMC free article] [PubMed] [Google Scholar]
- Allen GA, Ford VS, Gottlieb LD. A new species of Clarkia concinna (Onagraceae) from Marin County, California. Madroño. 1990;37:305–310. [Google Scholar]
- Anacker BL, Strauss SY. The geography and ecology of plant speciation: Range overlap and niche divergence in sister species. Proc R Soc B: Biol Sci. 2014;281:1778. doi: 10.1098/rspb.2013.2980. [DOI] [PMC free article] [PubMed] [Google Scholar]
- Artz DR, Villagra CA, Raguso RA. Spatiotemporal variation in the reproductive ecology of two parapatric subspecies of Oenothera cespitosa (Onagraceae) Am J Bot. 2010;97:1498–1510. doi: 10.3732/ajb.1000086. [DOI] [PubMed] [Google Scholar]
- R Core Team (2020) R: A language and environment for statistical computing. R Foundation for Statistical Computing, Vienna, Austria, https://www.R-project.org/
- Bloom WL. Origin of reciprocal translocations and their effect in Clarkia speciosa. Chromosoma. 1974;49:61–76. [Google Scholar]
- Bowman RN. Clarkia concinna subsp. automixa (Onagraceae), a new subspecies from the South Bay Region, Central California. Madroño. 1987;34:41–47. [Google Scholar]
- Campbell DR. Pollinator shifts and the origin and loss of plant species. Ann Mo Botanical Gard. 2008;95:264–274. [Google Scholar]
- Castellanos MC, Wilson P, Thomson JD. Pollen transfer by hummingbirds and bumblebees, and the divergence of pollination modes in Penstemon. Evolution. 2007;57:2742–2752. doi: 10.1111/j.0014-3820.2003.tb01516.x. [DOI] [PubMed] [Google Scholar]
- Catchen J, Hohenlohe PA, Bassham S, Amores A, Cresko WA. Stacks: An analysis tool set for population genomics. Mol Ecol. 2013;22:3124–3140. doi: 10.1111/mec.12354. [DOI] [PMC free article] [PubMed] [Google Scholar]
- Catchen JM, Amores A, Hohenlohe P, Cresko W, Postlethwait JH. Stacks: Building and genotyping loci de novo from short- read sequences. G3: Genes, Genomes. Genetics. 2011;1:171–182. doi: 10.1534/g3.111.000240. [DOI] [PMC free article] [PubMed] [Google Scholar]
- Charlesworth B. Fundamental concepts in genetics: Effective population size and patterns of molecular evolution and variation. Nat Rev Genet. 2009;10:195–205. doi: 10.1038/nrg2526. [DOI] [PubMed] [Google Scholar]
- Charlesworth B, Charlesworth D, Barton NH. The effects of genetic and geographic structure on neutral variation. Annu Rev Ecol Evol Syst. 2003;34:99–125. [Google Scholar]
- Cisternas-Fuentes A, Jogesh T, Broadhead GT, Raguso RA, Skogen KA, Fant JB. Evolution of selfing syndrome and its influence on genetic diversity and inbreeding: A range-wide study in Oenothera primiveris. Am J Bot. 2022;109(5):789–805. doi: 10.1002/ajb2.1861. [DOI] [PMC free article] [PubMed] [Google Scholar]
- Coulon A. GENHET: an easy-to-use R function to estimate individual heterozygosity. Mol Ecol Resour. 2010;10:167–169. doi: 10.1111/j.1755-0998.2009.02731.x. [DOI] [PubMed] [Google Scholar]
- Dellinger AS, Paun O, Baar J, Temsch EM, Fernández-Fernández D, Schönenberger J. Population structure in Neotropical plants: Integrating pollination biology, topography and climatic niches. Mol Ecol. 2022;31:2264–2280. doi: 10.1111/mec.16403. [DOI] [PMC free article] [PubMed] [Google Scholar]
- Diaz-Martin Z, Karubian J. Forest cover at landscape scales increases male and female gametic diversity of palm seedlings. Mol Ecol. 2021;30:4353–4367. doi: 10.1111/mec.16060. [DOI] [PubMed] [Google Scholar]
- Diaz-Martin Z, Browne L, Cabrera D, Olivo J, Karubian J. Impacts of flowering density on pollen dispersal and gametic diversity are scale dependent. Am Nat. 2023;201:52–64. doi: 10.1086/721918. [DOI] [PubMed] [Google Scholar]
- Do C, Waples RS, Peel D, Macbeth GM, Tillett BJ, Ovenden JR. NeEstimator v2: re-implementation of software for the estimation of contemporary effective population size (Ne) from genetic data. Mol Ecol Resour. 2014;4:209–14. doi: 10.1111/1755-0998.12157. [DOI] [PubMed] [Google Scholar]
- Doyle JJ, Doyle JL. A rapid DNA isolation procedure for small quantities of fresh leaf material. Phytochemical Bull. 1987;19:11–15. [Google Scholar]
- Dray S, Dufour A. The ade4 package: implementing the duality diagram for ecologists. J Stat Softw. 2007;22:1–20. [Google Scholar]
- Elshire RJ, Glaubitz JC, Sun Q, Poland JA, Kawamoto K, Buckler ES, et al. A Robust, Simple Genotyping-by-Sequencing (GBS) Approach for High Diversity Species. PLoS ONE. 2011;6(5):e19379. doi: 10.1371/journal.pone.0019379. [DOI] [PMC free article] [PubMed] [Google Scholar]
- Eschmann-Grupe G, Neuffer B, Hurka H. Extent and structure of genetic variation in two colonising Diplotaxis species (Brassicaceae) with contrasting breeding systems. Plant Syst Evol. 2004;244:31–43. [Google Scholar]
- Gamba D, Muchhala N. Global patterns of population genetic differentiation in seed plants. Mol Ecol. 2020;29:3413–3428. doi: 10.1111/mec.15575. [DOI] [PubMed] [Google Scholar]
- Gamba D, Muchhala N. Pollinator type strongly impacts gene flow within and among plant populations for six Neotropical species. Ecol. 2022;104(1):e3845. doi: 10.1002/ecy.3845. [DOI] [PubMed] [Google Scholar]
- Gilbert KJ, Whitlock MC. Evaluating methods for estimating local effective population size with and without migration. Evol. 2015;69:2154–2166. doi: 10.1111/evo.12713. [DOI] [PubMed] [Google Scholar]
- Goff KA, Martinez Del Rio C, Kay KM. A greenhouse experiment partially supports inferences of ecogeographic isolation from niche models of Clarkia sister species. Am J Bot. 2021;108:2002–2014. doi: 10.1002/ajb2.1756. [DOI] [PMC free article] [PubMed] [Google Scholar]
- Golczyk H, Massouh A, Greiner S. Translocations of Chromosome End-Segments and Facultative Heterochromatin Promote Meiotic Ring Formation in Evening Primroses. Plant Cell. 2014;26:1280–1293. doi: 10.1105/tpc.114.122655. [DOI] [PMC free article] [PubMed] [Google Scholar]
- Goldblatt P, Manning JC. Radiation of pollination systems in the Iridaceae of sub-Saharan Africa. Ann Bot. 2006;97:317–344. doi: 10.1093/aob/mcj040. [DOI] [PMC free article] [PubMed] [Google Scholar]
- Gottlieb LD, Weeden NF. Gene duplication and phylogeny in Clarkia. Evol. 1979;33(4):1024–1039. doi: 10.1111/j.1558-5646.1979.tb04759.x. [DOI] [PubMed] [Google Scholar]
- Groom MJ. Allee effects limit population viability of an annual plant. Am Nat. 1998;151:487–496. doi: 10.1086/286135. [DOI] [PubMed] [Google Scholar]
- Grossenbacher DL, Veloz SD, Sexton JP. Niche and range size patterns suggest that speciation begins in small, ecologically diverged populations in North American monkeyflowers (Mimulus spp.) Evol. 2014;68:1270–1280. doi: 10.1111/evo.12355. [DOI] [PubMed] [Google Scholar]
- Hamrick JL, Godt MJW. Effects of life history traits on genetic diversity in plant species. Philos Trans R Soc Lond. 1996;351:1291–1298. [Google Scholar]
- Heiser DA, Shaw RG. The fitness effects of outcrossing in Calylophus serrulatus, a permanent translocation heterozygote. Evolution. 2006;60:64–76. [PubMed] [Google Scholar]
- Hoban S, Paz-Vinasr I, Aitken S, Bertola L, Breed MF, Bruford MW, et al. Effective population size remains a suitable, pragmatic indicator of genetic diversity for all species, including forest trees. Biol Conserv. 2021;253:108906. [Google Scholar]
- Holsinger KE, Ellstrand NC. The evolution and ecology of permanent translocation heterozygotes. Am Nat. 1984;124:48–71. [Google Scholar]
- Hu XS. Mating system as a barrier to gene flow. Evo. 2015;69:1158–1177. doi: 10.1111/evo.12660. [DOI] [PubMed] [Google Scholar]
- Johansen DA. New chromosome numbers in the onagraceae. Am J Bot. 1929;16:595. [Google Scholar]
- Johnson MTJ, Smith SD, Rausher MD. Effects of plant sex on range distributions and allocation to reproduction. N. Phytol. 2010;186:769–779. doi: 10.1111/j.1469-8137.2010.03201.x. [DOI] [PubMed] [Google Scholar]
- Jombart T. adegenet: A R package for the multivariate analysis of genetic markers. Bioinformatics. 2008;24:1403–1405. doi: 10.1093/bioinformatics/btn129. [DOI] [PubMed] [Google Scholar]
- Kay KM, Sargent RD. The role of animal pollination in plant speciation: Integrating ecology, geography, and genetics. Annu Rev Ecol Evol Syst. 2009;40:637–656. [Google Scholar]
- Kay KM, Zepeda AM, Raguso RA. Experimental sympatry reveals geographic variation in floral isolation by hawkmoths. Ann Bot. 2019;123:405–413. doi: 10.1093/aob/mcy143. [DOI] [PMC free article] [PubMed] [Google Scholar]
- Kramer AT, Fant JB, Ashley MV. Influences of landscape and pollinators on population genetic structure: Examples from three Penstemon (Plantaginaceae) species in the Great Basin. Am J Bot. 2011;98:109–121. doi: 10.3732/ajb.1000229. [DOI] [PubMed] [Google Scholar]
- Krauss SL, Phillips RD, Karron JD, Johnson SD, Roberts GD, Hopper SD. Novel consequences of bird pollination for plant mating. Trends Plant Sci. 2017;22:395–410. doi: 10.1016/j.tplants.2017.03.005. [DOI] [PubMed] [Google Scholar]
- Lancaster LT, Kay KM. Origin and diversification of the California flora: Re-examining classic hypotheses with molecular phylogenies. Evolution. 2013;67:1041–1054. doi: 10.1111/evo.12016. [DOI] [PubMed] [Google Scholar]
- Levin DA. Environment-enhanced self-fertilization: implications for niche shifts in adjacent populations. J Ecol. 2010;98:1276–1283. [Google Scholar]
- Lewis H. The mechanism of evolution in the genus Clarkia. Evol. 1953;7:1–20. [Google Scholar]
- Lewis H. Chromosome phylogeny and habitat preference of Clarkia. Evolution. 1953;7:102–109. [Google Scholar]
- Lewis H, Lewis ME. The genus Clarkia. Univ Calif Publ Bot. 1955;20:241–392. [Google Scholar]
- Lloyd DG. Self- and cross-fertilization in plants. Int J Plant Sci. 1992;153:370–380. [Google Scholar]
- Lowry DB, Modliszewski JL, Wright KM, Wu CA, Willis JH. The strength and genetic basis of reproductive isolating barriers in flowering plants. Philos Trans R Soc Lond. 2008;363:3009–3021. doi: 10.1098/rstb.2008.0064. [DOI] [PMC free article] [PubMed] [Google Scholar]
- MacSwain J, Raven PH, Thorp R. Comparative behavior of bees and Onagraceae. IV. Clarkia bees of the western United States. Univ Calif Publ Entomol. 1973;70:1–80. [Google Scholar]
- Mastretta-Yanes A, Moreno-Letelier A, Piñero D, Jorgensen TH, Emerson BC. Biodiversity in the Mexican highlands and the interaction of geology, geography and climate within the Trans- Mexican Volcanic Belt. J Biogeogr. 2015;42:1586–1600. [Google Scholar]
- Miller TJ, Raguso RA, Kay KM. Novel adaptation to hawkmoth pollinators in Clarkia reduces efficiency, not attraction of diurnal visitors. Ann Bot. 2014;113:317–329. doi: 10.1093/aob/mct237. [DOI] [PMC free article] [PubMed] [Google Scholar]
- Moeller DA, Geber MA. Ecological context of the evolution of self-pollination in Clarkia xantiana: Population size, plant communities, and reproductive assurance. Evolution. 2005;59:786–799. doi: 10.1554/04-656. [DOI] [PubMed] [Google Scholar]
- Nathan R, Klein E, Robledo-Arnuncio JJ, Revilla E. Dispersal kernels: review. In: Clobert J, Baguette M, Benton TG, Bullock JM, editors. Dispersal ecology and evolution. Oxford: Oxford University Press; 2012. pp. 187–202. [Google Scholar]
- Nelson TC, Stathos AM, Vanderpool DD, Finseth FR, Yuan YW, Fishman L. Ancient and recent introgression shape the evolutionary history of pollinator adaptation and speciation in a model monkeyflower radiation (Mimulus section Erythranthe) PLoS Genet. 2021;17:1–26. doi: 10.1371/journal.pgen.1009095. [DOI] [PMC free article] [PubMed] [Google Scholar]
- Van der Niet T, Johnson SD. Phylogenetic evidence for pollinator-driven diversification of angiosperms. Trends Ecol Evol. 2012;27:353–361. doi: 10.1016/j.tree.2012.02.002. [DOI] [PubMed] [Google Scholar]
- Nordborg M. Structured coalescent processes on different time scale. Genetics. 1997;146:1501–1514. doi: 10.1093/genetics/146.4.1501. [DOI] [PMC free article] [PubMed] [Google Scholar]
- Nordborg M. Linkage disequilibrium, gene trees and selfing: An ancestral recombination graph with partial self-fertilization. Genetics. 2000;154:923–929. doi: 10.1093/genetics/154.2.923. [DOI] [PMC free article] [PubMed] [Google Scholar]
- Otto SP, Whitton J. Polyploid incidence and evolution. Annu Rev Genet. 2000;34:401–437. doi: 10.1146/annurev.genet.34.1.401. [DOI] [PubMed] [Google Scholar]
- Paris JR, Stevens JR, Catchen JR. Lost in parameter space: a road map for STACKS. Methods. Ecol Evol. 2017;8:1360–1373. [Google Scholar]
- Peterson ML, Kay KM. Mating system plasticity promotes persistence and adaptation of colonizing populations of hermaphroditic angiosperms. Am Nat. 2015;185:28–43. doi: 10.1086/679107. [DOI] [PubMed] [Google Scholar]
- Pettengill JB, Moeller DA. Phylogeography of speciation: Allopatric divergence and secondary contact between outcrossing and selfing Clarkia. Mol Ecol. 2012;21:4578–4592. doi: 10.1111/j.1365-294X.2012.05715.x. [DOI] [PubMed] [Google Scholar]
- Pettengill JB, Briscoe Runquist RD, Moeller DA. Mating system divergence aff ects the distribution of sequence diversity within and among populations of recently diverged subspecies of Clarkia xantiana (Onagraceae) Am Nat. 2016;103:99–109. doi: 10.3732/ajb.1500147. [DOI] [PubMed] [Google Scholar]
- Phillips RD, Peakall R, van der Niet T, Johnson SD. Niche perspectives on plant–pollinator interactions. Trends Plant Sci. 2020;25:779–793. doi: 10.1016/j.tplants.2020.03.009. [DOI] [PubMed] [Google Scholar]
- Phillips RD, Steinmeyer F, Menz MH, Erickson TE, Dixon KW. Changes in the composition and behaviour of a pollinator guild with plant population size and the consequences for plant fecundity. Funct Ecol. 2014;28:846–856. [Google Scholar]
- Pichersky E, Gottlieb LD. Evidence for duplication of the structural genes coding plastid and cytosolic isozymes of triose phosphate isomerase in diploid species of Clarkia. Genetics. 1983;105:421–436. doi: 10.1093/genetics/105.2.421. [DOI] [PMC free article] [PubMed] [Google Scholar]
- Pudovkin AI, Zaykin DV, Hedgecock D. On the potential for estimating the effective number of breeders from heterozygote-excess in progeny. Genet. 1996;144:383–387. doi: 10.1093/genetics/144.1.383. [DOI] [PMC free article] [PubMed] [Google Scholar]
- Purcell S, Neale B, Todd-Brown K, Thomas L, Ferreira MA, Bender D, Sham PC. PLINK: A tool set for whole- genome association and population-based linkage analyses. Am J Hum Genet. 2007;81:559–575. doi: 10.1086/519795. [DOI] [PMC free article] [PubMed] [Google Scholar]
- Raguso RA, Pichersky E. Systematics and Evolution (Onagraceae): recent evolution of floral scent and moth pollination. Plant Syst Evol. 1995;194:55–67. [Google Scholar]
- Raguso RA, Pichersky E. A day in the life of a linalool molecule: Chemical communication in a plant-pollinator system. Plant Species Biol. 1999;14:95–120. [Google Scholar]
- Raguso RA, Willis MA. Synergy between visual and olfactory cues in nectar feeding by wild hawkmoths, Manduca sexta. Anim Behav. 2005;69:407–418. [Google Scholar]
- Raven PH (1979) A Survey of Reproductive Biology in Onagraceae. New Zealand J Botany, 8643
- Rieseberg LH. Chromosomal rearrangements and speciation. TRENDS Ecol Evol. 2001;16:351–358. doi: 10.1016/s0169-5347(01)02187-5. [DOI] [PubMed] [Google Scholar]
- Rousset F. Genetic differentiation and estimation of gene flow from F statistics under isolation by distance. Genet. 1997;145:1219–1228. doi: 10.1093/genetics/145.4.1219. [DOI] [PMC free article] [PubMed] [Google Scholar]
- Schemske DW, Bradshaw HD. Pollinator preference and the evolution of floral traits in monkeyflowers (Mimulus) Proc Natl Acad Sci USA. 1999;96:21. doi: 10.1073/pnas.96.21.11910. [DOI] [PMC free article] [PubMed] [Google Scholar]
- Serbezov D, Jorde PE, Bernatchez L, Olsen EM, Asbjørn Vøllestad L. Short-term genetic changes: Evaluating effective population size estimates in a comprehensively described brown trout (Salmo Trutta) population. Genet. 2012;191:579–592. doi: 10.1534/genetics.111.136580. [DOI] [PMC free article] [PubMed] [Google Scholar]
- Shimizu KK, Cork JM, Caicedo AL, Mays CA, Moore RC, Olsen KM, Ruzsa S, Coop G, Bustamante CD, Awadalla P, Purugganan MD. Darwinian selection on a selfing locus. Science. 2004;306:2081–2084. doi: 10.1126/science.1103776. [DOI] [PubMed] [Google Scholar]
- Skogen KA, Overson RP, Hilpman ET, Fant JB. Hawkmoth pollination facilitates long-distance pollen dispersal and reduces isolation across a gradient of land-use change. Ann Mo Botanical Gard. 2019;104:495–511. [Google Scholar]
- Stebbins L. Adaptive radiation of reproductive characteristics in angiosperms, I: Pollination. Annu Rev Ecol Evol Syst. 1970;1:307–326. [Google Scholar]
- Steinecke C, Gorman CE, Stift M, Dorken ME. Outcrossing rates in an experimentally admixed population of self-compatible and self-incompatible Arabidopsis lyrata. Heredity. 2022;128:56–62. doi: 10.1038/s41437-021-00489-8. [DOI] [PMC free article] [PubMed] [Google Scholar]
- Sweigart AL, Willis JH. Patterns of nucleotide diversity in two species of Mimulus are affected by mating system and asymmetric introgression. Evolution. 2003;57:2490–2506. doi: 10.1111/j.0014-3820.2003.tb01494.x. [DOI] [PubMed] [Google Scholar]
- Sytsma KJ, Smith JF, Gottlieb LD. Phylogenetics in Clarkia (Onagraceae): restriction site mapping of chloroplast DNA. Syst Bot. 1990;15:280–295. [Google Scholar]
- Waples R, Do C. Linkage disequilibrium estimates of contemporary Ne using highly variable genetic markers: a largely untapped resource for applied conservation and evolution. Evol Appl. 2010;3:244–262. doi: 10.1111/j.1752-4571.2009.00104.x. [DOI] [PMC free article] [PubMed] [Google Scholar]
- Wedberg HL, Lewis H, Venkatesh CS. Translocation Heterozygotes and Supernumerary Chromosomes in Wild Populations of Clarkia williamsonii. Evol. 1968;22(1):93–107. doi: 10.1111/j.1558-5646.1968.tb03453.x. [DOI] [PubMed] [Google Scholar]
- Weir BS, Cockerham CC. Estimating F-Statistics for the analysis of population structure. Evol. 1984;38(6):1358–1470. doi: 10.1111/j.1558-5646.1984.tb05657.x. [DOI] [PubMed] [Google Scholar]
- Wessinger CA. From pollen dispersal to plant diversification: genetic consequences of pollination mode. N. Phytol. 2020;229:3125–3132. doi: 10.1111/nph.17073. [DOI] [PubMed] [Google Scholar]
- Willmott AP, Burquez A. The pollination of Merremia palmeri (Convolvulaceae): can hawk moths be trusted? Am J Bot. 1996;83:1050–1056. [Google Scholar]
- Wright SI, Kalisz S, Slotte T. Evolutionary consequences of self-fertilization in plants. Proc R Soc B: Biol Sci. 2013;280:1760. doi: 10.1098/rspb.2013.0133. [DOI] [PMC free article] [PubMed] [Google Scholar]
- Zhdanova OL, Pudovkin AI. Nb_HetEx: A program to estimate the effective number of breeders. J Hered. 2008;99:694–695. doi: 10.1093/jhered/esn061. [DOI] [PubMed] [Google Scholar]
Associated Data
This section collects any data citations, data availability statements, or supplementary materials included in this article.
Supplementary Materials
Data Availability Statement
Relevant data and code have been uploaded to a Dryad repository: 10.5061/dryad.sxksn038b.